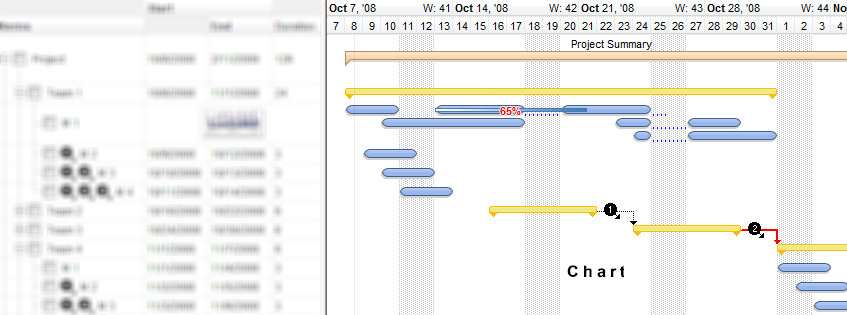
The following screen shots show only the chart part of the control:
The Chart object supports the following properties and methods:
The following screen shots show only the chart part of the control:
The Chart object supports the following properties and methods:


| Name | Description | |||
| AddNonworkingDate | Adds a nonworking date. | |||
| AdjustLevelsToBase | Specifies whether the levels are adjusted on the base level. | |||
| AllowCreateBar | Allows creating new bars using the mouse. | |||
| AllowInsideZoom | Specifies whether the chart can magnify only parts of the chart. | |||
| AllowLinkBars | Specifies whether the user can link the bars using the mouse. | |||
| AllowNonworkingBars | Specifies whether the chart treats bars with exBarTreatAsNonworking as non-working parts of the item. | |||
| AllowOverviewZoom | Gets or sets a value that indicates whether the user can zoom the chart at runtime. | |||
| AllowResizeChart | Specifies whether the user can enlarge (zoom-in,zoom-out) or resize the chart using the control's header, middle mouse button. | |||
| AllowResizeInsideZoom | Specifies whether the user can resize the inside zoom unit. | |||
| AllowSelectDate | Specifies whether the user selects dates at runtime. | |||
| AllowSelectObjects | Sets or gets a value that indicates whether the user can select objects in the chart. | |||
| AllowSplitPane | Specifies whether the chart panel supports splitting. | |||
| AllowUndoRedo | Enables or disables the Undo/Redo feature. | |||
| AllowZoomOnFly | Magnifies the bar from the cursor, when the user presses the CTRL / SHIFT key combination. | |||
| AMPM | Specifies the AM and PM indicators. | |||
| BackColor | Retrieves or sets a value that indicates the chart's background color. | |||
| BackColorLevelHeader | Specifies the background color for the chart's levels. | |||
| BackColorZoomOnFly | Specifies the background color for the zoom-on-fly panel. | |||
| BarFromPoint | Retrieves the bar from point. | |||
| Bars | Retrieves the Bars collection. | |||
| BarsAllowSizing | Specifies whether bars can be resized at run-time. | |||
| CanRedo | Retrieves a value that indicates whether the chart can perform a Redo operation. | |||
| CanUndo | Retrieves a value that indicates whether the chart can perform an Undo operation. | |||
| ClearItemBackColor | Clears the item's background color in the chart area. | |||
| ClearNonworkingDates | Clears nonworking dates. | |||
| ColumnsFont | Retrieves or sets the font to display the columns in the chart section. | |||
| ColumnsFormatLevel | Specifies the CRD format layout to display the columns in the chart section. | |||
| ColumnsTransparent | Specifies the percent of the transparency to display the columns in the chart. | |||
| CondInsideZoom | Specifies the formula that indicates the dates that can be zoomed at runtime. | |||
| CountVisibleUnits | Counts the number of units within the specified range. | |||
| DateFromPoint | Retrieves the date from the cursor. | |||
| DateTickerLabel | Retrieves or sets a value that indicates the format to display the bar's start and end date while creating, moving or resizing it. | |||
| DefaultInsideZoomFormat | Retrieves the format of the inside zoom units. | |||
| DrawDateTicker | Retrieves or sets a value that indicates whether the control draws a ticker around the current date while cursor hovers the chart's client area. | |||
| DrawGridLines | Retrieves or sets a value that indicates whether the grid lines are visible or hidden. | |||
| DrawLevelSeparator | Retrieves or sets a value that indicates whether lines between levels are shown or hidden. | |||
| EndBlockUndoRedo | Ends recording the UI operations and adds the undo/redo operations as a block, so they all can be restored at once, if Undo method is performed. | |||
| EndPrintDate | Retrieves or sets a value that indicates the printing end date. | |||
| FirstVisibleDate | Retrieves or sets a value that indicates the first visible date. | |||
| FirstWeekDay | Specifies the first day of the week. | |||
| ForeColor | Retrieves or sets a value that indicates the chart's foreground color. | |||
| ForeColorLevelHeader | Specifies the foreground color for the chart's levels. | |||
| FormatDate | Formats the date. | |||
| GridLineStyle | Retrieves or sets a value that indicates style for the gridlines being shown in the chart area. | |||
| GroupUndoRedoActions | Groups the next to current Undo/Redo Actions in a single block. | |||
| HistogramBackColor | Specifies the background color of the chart's histogram. | |||
| HistogramHeaderVisible | Specifies whether a copy of chart's header is displayed in the bottom side of the histogram. | |||
| HistogramHeight | Specifies whether the height of the chart's histogram. | |||
| HistogramUnitCount | Specifies the time-scale count to determine the effort of bars with variable-effort (effort of expression/string type) | |||
| HistogramUnitScale | Specifies the time-scale unit to determine the effort of bars with variable-effort (effort of expression/string type) | |||
| HistogramValue | Gets the value in the histogram at specified date-time, for giving type of bars or/and groups. | |||
| HistogramValueFromPoint | Retrieves the value from the histogram at the cursor position. | |||
| HistogramView | Specifies the list of items being included in the histogram. | |||
| HistogramVisible | Specifies whether the chart's histogram layout is visible or hidden. | |||
| HistogramZOrder | Specifies the z-order of the bars to be shown within the chart's histogram. | |||
| HotBackColor | Gets or sets the background color applied to the chart section of the control during hot-tracking. | |||
| HotForeColor | Gets or sets the foreground color applied to the chart section of the control during hot-tracking. | |||
| InsideZoomOnDblClick | Gets or sets a value that indicates whether a portion of the chart is magnified or zoomed when the user double click a date. | |||
| InsideZooms | Retrieves the collection of inside zoom dates. | |||
| IsDateVisible | Specifies whether the date fits the control's chart area. | |||
| IsNonworkingDate | Specifies whether giving date-time is a nonworking unit. | |||
| ItemBackColor | Retrieves or sets a background color for a specific item, in the chart area. | |||
| Label | Retrieves or sets a value that indicates the predefined format of the level's label for a specified unit. | |||
| LabelToolTip | Retrieves or sets a value that indicates the predefined format of the level's tooltip for a specified unit. | |||
| Level | Retrieves the level based on its index. | |||
| LevelCount | Specifies the number of levels in the control's header. | |||
| LevelFromPoint | Retrieves the index of the level from the point. | |||
| LinkFromPoint | Retrieves the link from the point. | |||
| LinksColor | Specifies the color to draw the links between the bars. | |||
| LinksStyle | Specifies the style to draw the links between the bars. | |||
| LinksWidth | Specifies the width in pixels of the pen to draw the links between the bars. | |||
| LocAMPM | Retrieves the time marker such as AM or PM using the current user regional and language settings. | |||
| LocFirstWeekDay | Indicates the first day of the week, as specified in the regional settings. | |||
| LocMonthNames | Retrieves the list of month names, as indicated in the regional settings, separated by space. | |||
| LocWeekDays | Retrieves the list of names for each week day, as indicated in the regional settings, separated by space. | |||
| MarkNow | Specifies the the current time to show in the chart. | |||
| MarkNowColor | Specifies the background color or the visual appearance of the object that indicates the current time in the chart. | |||
| MarkNowCount | Specifies the number of time units to count while highlighting the current time. | |||
| MarkNowDelay | Specifies the delay to show the current time in the chart. | |||
| MarkNowTransparent | Specifies the percent of the transparency to display the object that marks the current time. | |||
| MarkNowUnit | Retrieves or sets a value that indicates the base time unit while highlighting the current time. | |||
| MarkNowWidth | Specifies the width in pixels of the object that shows the current time. | |||
| MarkSelectDateColor | Retrieves or sets a value that indicates the color to mark the selected date in the chart. | |||
| MarkTimeZone | Highlights a specified time zone from start to end with a different background color, pattern, transparency, HTML captions and so on. | |||
| MarkTodayColor | Retrieves or sets a value that indicates the color to mark today in the chart. | |||
| MaxUnitWidth | Specifies the maximum value for Chart.UnitWidth property while enlarge or zoom-in/zoom-out operation is performed. | |||
| MinUnitWidth | Specifies the minimum value for Chart.UnitWidth property while enlarge or zoom-in/zoom-out operation is performed. | |||
| MonthNames | Retrieves or sets a value that indicates the list of month names, separated by space. | |||
| NextDate | Gets the next date based on the unit. | |||
| NonworkingDays | Retrieves or sets a value that indicates the non-working days, for each week day a bit. | |||
| NonworkingDaysColor | Retrieves or sets a value that indicates the color to fill the non-working days. | |||
| NonworkingDaysPattern | Retrieves or sets a value that indicates the pattern being used to fill non-working days. | |||
| NonworkingHours | Retrieves or sets a value that indicates the non-working hours, for each hour in a day a bit. | |||
| NonworkingHoursColor | Retrieves or sets a value that indicates the color to fill the non-working hours. | |||
| NonworkingHoursPattern | Retrieves or sets a value that indicates the pattern being used to fill non-working hours. | |||
| NoteFromPoint | Retrieves the note from the point. | |||
| Notes | Retrieves the Notes collection. | |||
| OverlaidOnMoving | Specifies whether the overlaid bars are re-arranged while the user moves or resizes at runtime a bar. | |||
| OverviewBackColor | Specifies the background color of the chart's overview. | |||
| OverviewHeight | Indicates the height of the chart's overview. | |||
| OverviewLevelLines | Indicates the index of the level that displays the grid line in the chart's overview. | |||
| OverviewMarginsFormat | Defines the format used to display margin dates in the overview section of the control. | |||
| OverviewSelBackColor | Specifies the selection color of the chart's overview. | |||
| OverviewSelTransparent | Specifies the percent of the transparency to display the selection in the overview parts of the control. | |||
| OverviewShowMarkTimeZones | Specifies whether the chart's overview shows the marked time-zones. | |||
| OverviewShowSelectDates | Specifies whether the chart's overview shows the selected dates. | |||
| OverviewToolTip | Retrieves or sets a value that indicates the format of the tooltip being shown while the cursor hovers the chart's overview area. | |||
| OverviewVisible | Specifies whether the chart's overview layout is visible or hidden. | |||
| OverviewZoomCaption | Specifies the captions for each zooming unit. | |||
| OverviewZoomUnit | Indicates the width in pixels of the zooming unit in the overview. | |||
| PaneWidth | Specifies the width for the left or side pane. | |||
| Picture | Retrieves or sets a graphic to be displayed in the chart. | |||
| PictureDisplay | Retrieves or sets a value that indicates the way how the graphic is displayed on the chart's background | |||
| Redo | Redoes the next action in the chart's Redo queue. | |||
| RedoListAction | Lists the Redo actions that can be performed in the chart. | |||
| RedoRemoveAction | Removes the first redo actions that can be performed in the chart. | |||
| RemoveNonworkingDate | Removes a nonworking date. | |||
| RemoveSelection | Removes the selected objects within the chart. | |||
| RemoveTimeZone | Removes a time-zone being highlighted using the MarkTimeZone method. | |||
| ResizeUnitCount | Specifies the number of time units while resizing, moving or creating bars by dragging. | |||
| ResizeUnitScale | Retrieves or sets a value that indicates the base time unit while resizing, moving or creating the bars by dragging. | |||
| ScrollBar | Shows or hides the chart's horizontal scroll bar. | |||
| ScrollRange | Specifies the range of dates to scroll within. | |||
| ScrollTo | Scrolls the chart so the specified date is visible. | |||
| SelBackColor | Retrieves or sets a value that indicates the selection background color. | |||
| SelBarColor | Retrieves or sets a value that indicates the color or EBN object to display the selected bars. | |||
| SelectDate | Selects or unselects a specific date in the chart. | |||
| SelectDates | Indicates a collection of date-time units being selected. | |||
| SelectLevel | Indicates the index of the level that highlights the selected dates. | |||
| SelectOnClick | Specifies whether an item gets selected once the user clicks the chart area. | |||
| SelForeColor | Retrieves or sets a value that indicates the selection foreground color. | |||
| SelLinkColor | Specifies the color to show the selected link ( or for rectangular links an EBN object to highlights the link, without changing the link's color ). | |||
| ShowCollapsedBars | Gets or sets a value that indicates whether the collapsed items displays their child bars. | |||
| ShowEmptyBars | Specifies whether empty bars are shown or hidden. An empty bar has the start and end dates identical. | |||
| ShowEmptyBarsUnit | Specifies the unit to be added to the end date, so empty bars are shown. | |||
| ShowLinks | Retrieves or sets a value that indicates whether the links between bars are visible or hidden. | |||
| ShowLinksColor | Retrieves or sets a value that indicates the color to display the links based on the user selection. | |||
| ShowLinksStyle | Retrieves or sets a value that indicates the style to display the links based on the user selection. | |||
| ShowLinksWidth | Retrieves or sets a value that indicates the width to display the links based on the user selection. | |||
| ShowNonworkingDates | Shows or hides nonworking dates. | |||
| ShowNonworkingHours | Shows or hides nonworking hours. | |||
| ShowNonworkingUnits | Retrieves or sets a value that indicates whether the non-working units are visible or hidden. | |||
| ShowNotes | Specifies whether all notes or boxes are shown or hidden. | |||
| ShowTransparentBars | Gets or sets a value that indicates percent of the transparency to display the bars. | |||
| SplitPaneWidth | Specifies the width of split panels, separated by comma. | |||
| StartBlockUndoRedo | Starts recording the UI operations as a block of undo/redo operations. | |||
| StartPrintDate | Retrieves or sets a value that indicates the printing start date. | |||
| TimeZoneFromPoint | Retrieves the time-zone from the cursor. | |||
| TimeZoneInfo | Retrieves information about the time-zone giving its key. | |||
| ToolTip | Retrieves or sets a value that indicates the format of the tooltip being shown while the user scrolls the chart. | |||
| Undo | Performs the last Undo operation. | |||
| UndoListAction | Lists the Undo actions that can be performed in the chart. | |||
| UndoRedoQueueLength | Gets or sets the maximum number of Undo/Redo actions that may be stored to the chart's queue. | |||
| UndoRemoveAction | Removes the last the undo actions that can be performed in the chart. | |||
| UnitScale | Retrieves or sets a value that indicates the base unit being displayed. | |||
| UnitWidth | Specifies the width in pixels for the minimal unit. | |||
| UnitWidthNonworking | Specifies the width in pixels for the minimal unit. | |||
| UnselectDates | Unselects all dates in the chart. | |||
| UpdateOnMoving | Specifies whether the control moves or resizes all related bars or just the bar being moved or resized. | |||
| WeekDays | Retrieves or sets a value that indicates the list of names for each week day, separated by space. | |||
| WeekNumberAs | Specifies the way the control displays the week number. | |||
| Zoom | Sets or retrieves the magnification scale of the chart. | |||
| ZoomOnFlyCaption | Specifies the caption to be shown in the zoom-on-fly panel, when the cursor hovers a bar. |