A date-time zone can display a:
- solid background color or using an EBN to display a skin object
- pattern ( by default, is exPatternSolid )
- transparency ( by default, it is 0 which means opaque while, 50 means semi-transparent and 100 means transparent )
Also, a zone can display multiple HTML captions aligned to any corner of the zone. By default, all HTML captions are aligned to the bottom center area.
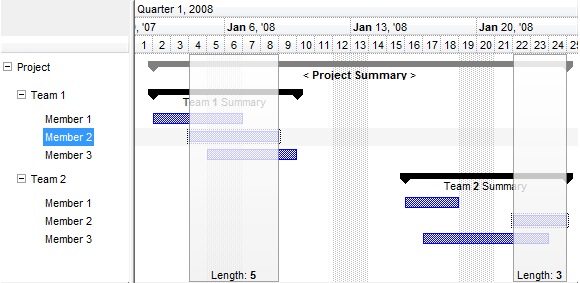
The following screen shot shows two zones being marked :
The Options parameter contains a list of fields separated by ; character as following:
- Transparency[:Width], indicating the transparency : fixed width zone. The transparency is value from 0 to 100, ( 0 by default or missing - opaque, 50 - semi-transparent, 100 - hidden or fully transparent ). For instance,MarkTimeZone "Z1",#1/4/2010 10:00:00 AM#,#1/4/2010 10:00:00 AM#,RGB(255,0,0),"50:3;;zone" adds a red vertical line of 3-pixels wide, with a semi-transparent color, that displays "zone" at Jan 4th, 2010, at 10:00 AM. If Width field is missing, the zone is delimited by the Start and End parameters, with a visible width of minimum 1-pixel wide. If the Width field is specified, it indicates the actually width of the zone which is displayed at (Start + End) / 2.
- Pattern as described here, ( 1/exPatternSolid by default or missing - solid )
- HTML caption to be displayed in the zone, that may contains HTML tags as listed here on exHTML. The caption may include anchor elements that fires the AnchorClick event when it is clicked.
- Alignment of the HTML caption with the values listed here.
The list continues by pair of HTML/Alignment elements. For instance, the ";;Caption <b>1</b>;1;Caption <b>2</b>;17;Caption <b>3</b>" specifies a three captions to be shown in the zone. For instance, the "50;;text to be shown,1" indicates that the zone is semi-transparent (5), displays a solid color ( the pattern field is missing ), and it displays "text to be shown" in the upper-center position of the zone.
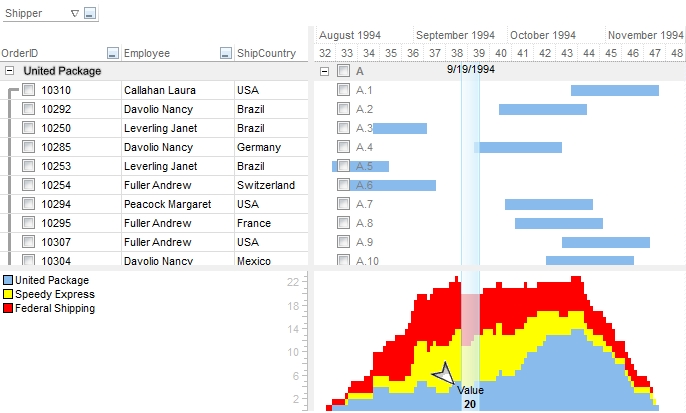
By default, the text of the mark-time zone is not displayed in the chart's histogram area ( HistogramVisible property ), but you can provide multiple HTML caption to the histogram panels, after a ";;;" sequence as in the following sample: "25;;9/19/1994;1;;;Value<br><c><b>20;33" and it should look like follows: