

Newer versions support Regional and Language Options for tags such as:
- <%loc_sdate%> - Indicates the date in the short format using the current user settings.
- <%loc_ldate%> - Indicates the date in the long format using the current user settings.
- <%loc_d1%> - Indicates day of week as a one-letter abbreviation using the current user settings.
- <%loc_d2%> - Indicates day of week as a two-letters abbreviation using the current user settings.
- <%loc_d3%> equivalent with <%loc_ddd%>
- <%loc_ddd%> - Indicates day of week as a three-letters abbreviation using the current user settings.
- <%loc_dddd%> - Indicates day of week as its full name using the current user settings.
- <%loc_m1%> - Indicates month as a one-letter abbreviation using the current user settings.
- <%loc_m2%> - Indicates month as a two-letters abbreviation using the current user settings.
- <%loc_m3%> - equivalent with <%loc_mmm%>
- <%loc_mmm%> - Indicates month as a three-letters abbreviation using the current user settings.
- <%loc_mmmm%> - Indicates month as its full name using the current user settings.
- <%loc_gg%> - Indicates period/era using the current user settings.
- <%loc_dsep%> - Indicates the date separator using the current user settings.
- <%loc_time%> - Indicates the time using the current user settings.
- <%loc_time24%> - Indicates the time in 24 hours format without a time marker using the current user settings.
- <%loc_AM/PM%> - Indicates the time marker such as AM or PM using the current user settings.
- <%loc_A/P%> - Indicates the one character time marker such as A or P using the current user settings.
- <%loc_tsep%> - Indicates the time separator using the current user settings.
You can use these in methods as: Level.Label, Level.ToolTip, Chart.Label, Chart.LabelToolTip, Chart.FormatDate, Chart.OverviewToolTip, Chart.ToolTip, InsideZoomFormat.InsideLabel, InsideZoomFormat.OwnerLabel, Note.PartText and Note.Text ( where supported ).
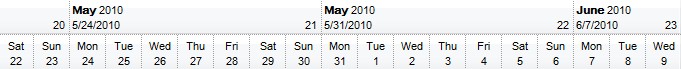
The following screen shot shows the chart's header for English (United States) format:
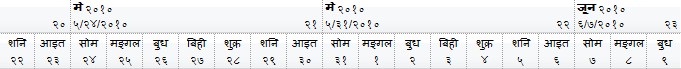
The following screen shot shows the chart's header for Nepali (Nepal) format:
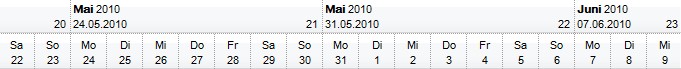
The following screen shot shows the chart's header for German (Germany) format:
With G2antt1
	.BeginUpdate
	.Font.Name = "Arial Unicode MS"
	.HeaderHeight = 36
	With .Chart
		.FirstVisibleDate = #5/30/2010#
		.PaneWidth(False) = 0
		.FirstWeekDay = 1
		.UnitWidth = 36
		.LevelCount = 2
		With .Level(0)
			.Label = "<b><%loc_mmmm%></b> <%yyyy%><br><%loc_sdate%><r> <%ww%> "
			.ToolTip = .Label
			.Unit = 256
		End With
		With .Level(1)
			.Label = "<%loc_ddd%><br><%d%>"
			.ToolTip = .Label
		End With
		.ToolTip = "<%loc_ldate%>"
	End With
	.EndUpdate
End With
The following VB6 sample shows how you can specify the levels using the user's Regional and Language Options?
With G2antt1
	.BeginUpdate
	.Font.Name = "Arial Unicode MS"
	.HeaderHeight = 36
	With .Chart
		.FirstVisibleDate = #5/30/2010#
		.PaneWidth(False) = 0
		.FirstWeekDay = exMonday
		.UnitWidth = 36
		.LevelCount = 2
		With .Level(0)
			.Label = "<b><%loc_mmmm%></b> <%yyyy%><br><%loc_sdate%><r> <%ww%> "
			.ToolTip = .Label
			.Unit = exWeek
		End With
		With .Level(1)
			.Label = "<%loc_ddd%><br><%d%>"
			.ToolTip = .Label
		End With
		.ToolTip = "<%loc_ldate%>"
	End With
	.EndUpdate
End With
The following VB.NET sample shows how you can specify the levels using the user's Regional and Language Options?
With Exg2antt1
	.BeginUpdate()
	.Font.Name = "Arial Unicode MS"
	.HeaderHeight = 36
	With .Chart
		.FirstVisibleDate = #5/30/2010#
		.set_PaneWidth(False,0)
		.FirstWeekDay = exontrol.EXG2ANTTLib.WeekDayEnum.exMonday
		.UnitWidth = 36
		.LevelCount = 2
		With .get_Level(0)
			.Label = "<b><%loc_mmmm%></b> <%yyyy%><br><%loc_sdate%><r> <%ww%> "
			.ToolTip = .Label
			.Unit = exontrol.EXG2ANTTLib.UnitEnum.exWeek
		End With
		With .get_Level(1)
			.Label = "<%loc_ddd%><br><%d%>"
			.ToolTip = .Label
		End With
		.ToolTip = "<%loc_ldate%>"
	End With
	.EndUpdate()
End With
The following VB.NET for /COM sample shows how you can specify the levels using the user's Regional and Language Options?
With AxG2antt1
	.BeginUpdate()
	.Font.Name = "Arial Unicode MS"
	.HeaderHeight = 36
	With .Chart
		.FirstVisibleDate = #5/30/2010#
		.PaneWidth(False) = 0
		.FirstWeekDay = EXG2ANTTLib.WeekDayEnum.exMonday
		.UnitWidth = 36
		.LevelCount = 2
		With .Level(0)
			.Label = "<b><%loc_mmmm%></b> <%yyyy%><br><%loc_sdate%><r> <%ww%> "
			.ToolTip = .Label
			.Unit = EXG2ANTTLib.UnitEnum.exWeek
		End With
		With .Level(1)
			.Label = "<%loc_ddd%><br><%d%>"
			.ToolTip = .Label
		End With
		.ToolTip = "<%loc_ldate%>"
	End With
	.EndUpdate()
End With
The following C++ sample shows how you can specify the levels using the user's Regional and Language Options?
/*
	Copy and paste the following directives to your header file as
	it defines the namespace 'EXG2ANTTLib' for the library: 'ExG2antt 1.0 Control Library'

	#import <ExG2antt.dll>
	using namespace EXG2ANTTLib;
*/
EXG2ANTTLib::IG2anttPtr spG2antt1 = GetDlgItem(IDC_G2ANTT1)->GetControlUnknown();
spG2antt1->BeginUpdate();
spG2antt1->GetFont()->PutName(L"Arial Unicode MS");
spG2antt1->PutHeaderHeight(36);
EXG2ANTTLib::IChartPtr var_Chart = spG2antt1->GetChart();
	var_Chart->PutFirstVisibleDate("5/30/2010");
	var_Chart->PutPaneWidth(VARIANT_FALSE,0);
	var_Chart->PutFirstWeekDay(EXG2ANTTLib::exMonday);
	var_Chart->PutUnitWidth(36);
	var_Chart->PutLevelCount(2);
	EXG2ANTTLib::ILevelPtr var_Level = var_Chart->GetLevel(0);
		var_Level->PutLabel("<b><%loc_mmmm%></b> <%yyyy%><br><%loc_sdate%><r> <%ww%> ");
		var_Level->PutToolTip(var_Level->GetLabel());
		var_Level->PutUnit(EXG2ANTTLib::exWeek);
	EXG2ANTTLib::ILevelPtr var_Level1 = var_Chart->GetLevel(1);
		var_Level1->PutLabel("<%loc_ddd%><br><%d%>");
		var_Level1->PutToolTip(var_Level1->GetLabel());
	var_Chart->PutToolTip(L"<%loc_ldate%>");
spG2antt1->EndUpdate();
The following C# sample shows how you can specify the levels using the user's Regional and Language Options?
exg2antt1.BeginUpdate();
exg2antt1.Font.Name = "Arial Unicode MS";
exg2antt1.HeaderHeight = 36;
exontrol.EXG2ANTTLib.Chart var_Chart = exg2antt1.Chart;
	var_Chart.FirstVisibleDate = Convert.ToDateTime("5/30/2010");
	var_Chart.set_PaneWidth(false,0);
	var_Chart.FirstWeekDay = exontrol.EXG2ANTTLib.WeekDayEnum.exMonday;
	var_Chart.UnitWidth = 36;
	var_Chart.LevelCount = 2;
	exontrol.EXG2ANTTLib.Level var_Level = var_Chart.get_Level(0);
		var_Level.Label = "<b><%loc_mmmm%></b> <%yyyy%><br><%loc_sdate%><r> <%ww%> ";
		var_Level.ToolTip = var_Level.Label;
		var_Level.Unit = exontrol.EXG2ANTTLib.UnitEnum.exWeek;
	exontrol.EXG2ANTTLib.Level var_Level1 = var_Chart.get_Level(1);
		var_Level1.Label = "<%loc_ddd%><br><%d%>";
		var_Level1.ToolTip = var_Level1.Label;
	var_Chart.ToolTip = "<%loc_ldate%>";
exg2antt1.EndUpdate();
The following C# for /COM sample shows how you can specify the levels using the user's Regional and Language Options?
axG2antt1.BeginUpdate();
axG2antt1.Font.Name = "Arial Unicode MS";
axG2antt1.HeaderHeight = 36;
EXG2ANTTLib.Chart var_Chart = axG2antt1.Chart;
	var_Chart.FirstVisibleDate = Convert.ToDateTime("5/30/2010");
	var_Chart.set_PaneWidth(false,0);
	var_Chart.FirstWeekDay = EXG2ANTTLib.WeekDayEnum.exMonday;
	var_Chart.UnitWidth = 36;
	var_Chart.LevelCount = 2;
	EXG2ANTTLib.Level var_Level = var_Chart.get_Level(0);
		var_Level.Label = "<b><%loc_mmmm%></b> <%yyyy%><br><%loc_sdate%><r> <%ww%> ";
		var_Level.ToolTip = var_Level.Label;
		var_Level.Unit = EXG2ANTTLib.UnitEnum.exWeek;
	EXG2ANTTLib.Level var_Level1 = var_Chart.get_Level(1);
		var_Level1.Label = "<%loc_ddd%><br><%d%>";
		var_Level1.ToolTip = var_Level1.Label;
	var_Chart.ToolTip = "<%loc_ldate%>";
axG2antt1.EndUpdate();
The following VFP sample shows how you can specify the levels using the user's Regional and Language Options?
with thisform.G2antt1
	.BeginUpdate
	.Font.Name = "Arial Unicode MS"
	.HeaderHeight = 36
	with .Chart
		.FirstVisibleDate = {^2010-5-30}
		.PaneWidth(.F.) = 0
		.FirstWeekDay = 1
		.UnitWidth = 36
		.LevelCount = 2
		with .Level(0)
			.Label = "<b><%loc_mmmm%></b> <%yyyy%><br><%loc_sdate%><r> <%ww%> "
			.ToolTip = .Label
			.Unit = 256
		endwith
		with .Level(1)
			.Label = "<%loc_ddd%><br><%d%>"
			.ToolTip = .Label
		endwith
		.ToolTip = "<%loc_ldate%>"
	endwith
	.EndUpdate
endwith
The following Delphi sample shows how you can specify the levels using the user's Regional and Language Options?
with AxG2antt1 do
begin
	BeginUpdate();
	Font.Name := 'Arial Unicode MS';
	HeaderHeight := 36;
	with Chart do
	begin
		FirstVisibleDate := '5/30/2010';
		PaneWidth[False] := 0;
		FirstWeekDay := EXG2ANTTLib.WeekDayEnum.exMonday;
		UnitWidth := 36;
		LevelCount := 2;
		with Level[0] do
		begin
			Label := '<b><%loc_mmmm%></b> <%yyyy%><br><%loc_sdate%><r> <%ww%> ';
			ToolTip := Label;
			Unit := EXG2ANTTLib.UnitEnum.exWeek;
		end;
		with Level[1] do
		begin
			Label := '<%loc_ddd%><br><%d%>';
			ToolTip := Label;
		end;
		ToolTip := '<%loc_ldate%>';
	end;
	EndUpdate();
end
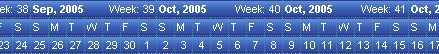
The first level displays the month, the year and the number of the week in the year , the second level displays the name of the week day, and the third level displays the day of the month. The LevelCount property specifies the number of levels being displayed, in our case 3.
The following Template shows how to display your header using three levels as arranged in the picture above ( just copy and paste the following script to Template page ):
BeginUpdate()
Chart
{
	LevelCount = 3
	Level(0)
	{
		Label = "<b><%mmm%>, <%yyyy%></b> <r>Week: <%ww%>"
		Unit = 256	'exWeek
	}
	Level(1).Label = "<%d1%>"
	Level(2).Label = "<%d%>"
}
EndUpdate()
The following VB sample displays your header using 3 levels as shown above:
With G2antt1
    .BeginUpdate
    With .Chart
        .LevelCount = 3
        With .Level(0)
            .Label = "<b><%mmm%>, <%yyyy%></b> <r>Week: <%ww%>"
            .Unit = EXG2ANTTLibCtl.UnitEnum.exWeek
        End With
        .Level(1).Label = "<%d1%>"
        .Level(2).Label = "<%d%>"
    End With
    .EndUpdate
End With
The following VFP sample displays your header using 3 levels:
with thisform.g2antt1
.BeginUpdate()
with .Chart
	.LevelCount = 3
	with .Level(0)
		.Label = "<b><%mmm%>, <%yyyy%></b> <r>Week: <%ww%>"
		.Unit = 256
	endwith
	.Level(1).Label = "<%d1%>"
	.Level(2).Label = "<%d%>"
endwith
.EndUpdate()
endwith
The following VB.NET sample displays your header using 3 levels:
With AxG2antt1
    .BeginUpdate()
    With .Chart
        .LevelCount = 3
        With .Level(0)
            .Label = "<b><%mmm%>, <%yyyy%></b> <r>Week: <%ww%>"
            .Unit = EXG2ANTTLib.UnitEnum.exWeek
        End With
        .Level(1).Label = "<%d1%>"
        .Level(2).Label = "<%d%>"
    End With
    .EndUpdate()
End With
The following C# sample displays your header using 3 levels:
axG2antt1.BeginUpdate();
EXG2ANTTLib.Chart chart = axG2antt1.Chart;
chart.LevelCount = 3;
chart.get_Level(0).Label = "<b><%mmm%>, <%yyyy%></b> <r>Week: <%ww%>";
chart.get_Level(0).Unit = EXG2ANTTLib.UnitEnum.exWeek;
chart.get_Level(1).Label = "<%d1%>";
chart.get_Level(2).Label = "<%d%>";
axG2antt1.EndUpdate();
The following C++ sample displays your header using 3 levels:
m_g2antt.BeginUpdate();
CChart chart = m_g2antt.GetChart();
chart.SetLevelCount( 3 );
chart.GetLevel(0).SetLabel(COleVariant( "<b><%mmm%>, <%yyyy%></b> <r>Week: <%ww%>" ));
chart.GetLevel(0).SetUnit(256);
chart.GetLevel(1).SetLabel(COleVariant( "<%d1%>" ));
chart.GetLevel(2).SetLabel(COleVariant( "<%d%>" ));
m_g2antt.EndUpdate();
The following VB sample enumerates the levels in the chart:
With G2antt1.Chart
    Dim i As Long
    For i = 0 To .LevelCount - 1
        With .Level(i)
            Debug.Print .Label
        End With
    Next
End With
The following C++ sample enumerates the levels in the chart:
CChart chart = m_g2antt.GetChart();
for ( long i = 0; i < chart.GetLevelCount(); i++ )
{
	CLevel level = chart.GetLevel( i );
	OutputDebugString( V2S( &level.GetLabel() ) );
}
where the V2S function converts a Variant expression to a string expression:
static CString V2S( VARIANT* pvtDate )
{
	COleVariant vtDate;
	vtDate.ChangeType( VT_BSTR, pvtDate );
	return V_BSTR( &vtDate );
}
The following VB.NET sample enumerates the levels in the chart:
With AxG2antt1.Chart
    Dim i As Long
    For i = 0 To .LevelCount - 1
        With .Level(i)
            Debug.Write(.Label())
        End With
    Next
End With
The following C# sample enumerates the levels in the chart:
for (int i = 0; i < axG2antt1.Chart.LevelCount; i++)
{
	EXG2ANTTLib.Level level = axG2antt1.Chart.get_Level(i);
	System.Diagnostics.Debug.Write(level.Label);
}
The following VFP sample enumerates the levels in the chart:
With thisform.G2antt1.Chart
    For i = 0 To .LevelCount - 1
        With .Level(i)
            wait window nowait .Label
        EndWith
    Next
EndWith