

If the HistogramView property is:
- exHistogramVisibleItems, the histogram includes only visible items. This can be combined with exHistogramLeafItems, exHistogramRecLeafItems or exHistogramNoGrouping. The Histogram is updated as soon as the control changes its first visible item, in other words the control gets vertically scrolled.
- exHistogramSelectedItems, The histogram is shown for the selected items only. Use the SingleSel property to specify whether the control can select multiple items. Use the SelectOnClick property to disable selecting new items when the user clicks the chart area. This can be combined with exHistogramLeafItems, exHistogramRecLeafItems or exHistogramNoGrouping. The Histogram is updated as soon as the selection is changed.
- exHistogramSelectedBars, The histogram is shown for the selected bars only. The ItemBar(exBarSelected) property specifies whether a bar is selected or unselected. The ChartSelectionChanged event notifies the application once a new bar is selected or unselected. This can be combined with exHistogramLeafItems, exHistogramRecLeafItems or exHistogramNoGrouping. The Histogram is updated as soon as the selection in the chart is changed.
- exHistogramCheckedItems, The histogram is shown for the checked items only. You must combine this with exHistogramUnlockedItems, exHistogramLockedTopItems or exHistogramLockedBottomItems. Also, this can be combined with exHistogramLeafItems, exHistogramRecLeafItems or exHistogramNoGrouping. Use the CellState property to specify the state of the cell. The histogram includes only items that have the CellState property on 1 ( locked and unlocked items ). By default, the check box should be on the first column ( the column with the index 0 ). Use the high word of the HistogramView property to specify a different column. For instance, if you need to display the histogram based on the check boxes of the column index 5, the HistogramView property should be 0x50000 + exHistogramCheckedItems + exHistogramUnlockedItems. Another sample, if the HistogramView property is exHistogramCheckedItems + exHistogramLockedBottomItems the histogram shows only the checked items in the bottom locked area. The Histogram is updated as soon as the user changes the state of the cell's check box
- exHistogramUnlockedItems, The histogram is shown only for unlocked items. Use the AddItem/InsertItem methods to add unlocked items. This option can be combined with exHistogramCheckedItems, exHistogramLockedTopItems or exHistogramLockedBottomItems. For instance, if the HistogramView property is exHistogramUnlockedItems + exHistogramLockedTopItems the histogram shows all the items in the unlocked plus the items in the top locked area.
- exHistogramLockedTopItems, The histogram is shown only for locked items in the top side of the control. Use the LockedItemCount property to specify how many items are in the locked area. This option can be combined with exHistogramCheckedItems, exHistogramUnlockedItems or exHistogramLockedBottomItems. For instance, if the HistogramView property is exHistogramUnlockedItems + exHistogramLockedTopItems the histogram shows all the items in the unlocked plus the items in the top locked area.
- exHistogramLockedBottomItems, The histogram is shown only for locked items in the bottom side of the control. Use the LockedItemCount property to specify how many items are in the locked area. This option can be combined with exHistogramCheckedItems, exHistogramUnlockedItems or exHistogramLockedTopItems. For instance, if the HistogramView property is exHistogramUnlockedItems + exHistogramLockedBottomItems the histogram shows all the items in the unlocked plus the items in the bottom locked area.
- exHistogramAllItems, The histogram is shown for all items, locked and unlocked items too. The exHistogramAllItems is a shortcut for the exHistogramUnlockedItems + exHistogramLockedTopItems + exHistogramLockedBottomItems. This can be combined with exHistogramLeafItems, exHistogramRecLeafItems or exHistogramNoGrouping.
- exHistogramLeafItems, The histogram shows the bars for leaf items, in other words, the item itself if contains no child items, or all child items that contains no other child items. Use this option to include in the histogram the bars in the child items too.
- exHistogramRecLeafItems, The histogram shows all bars for all recursive leaf items, so all child leaf items are displayed. Use this option to include in the histogram the bars in all child items ( recursively ) too.
- exHistogramNoGrouping, If present, the histogram shows all bars without grouping based on the item's parent, and so all bars shares the same space for the histogram. If missing, the bars included in the histogram are grouped based on their parents, and each group has allocated a space in the histogram, so each group is shown separately.
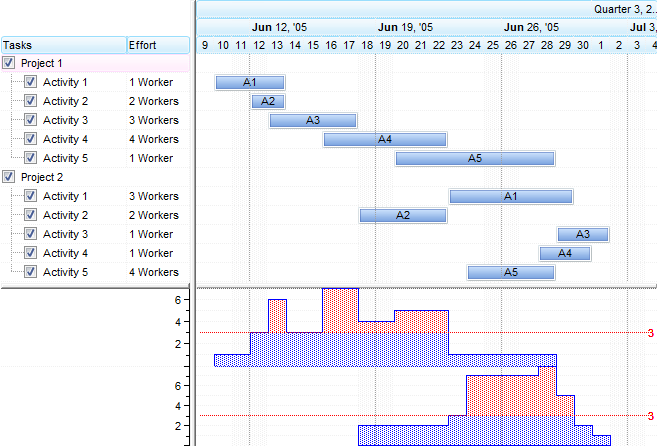
The following screen shot shows the items grouped by their parents ( the exHistogramNoGrouping option is not set )
The following screen shot shows the items grouped by their parents ( the exHistogramNoGrouping option is set )
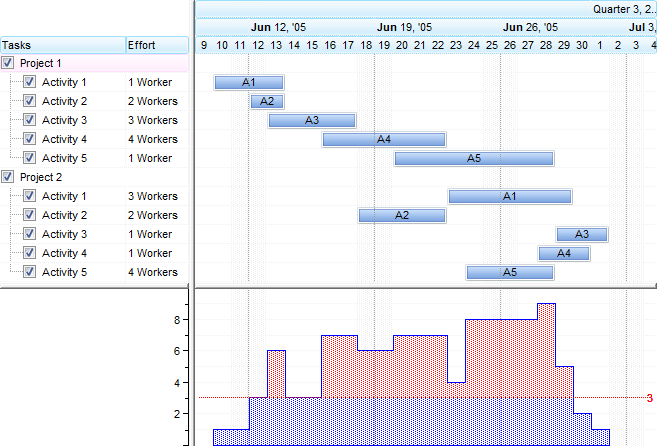
Only the exHistogramVisibleItems and exHistogramSelectedItems shows the histogram by grouping the items based on their common parent. The rest of options shows the histogram in the same space, without grouping.
Please follow the steps in order to view your bars in the histogram.
- Changes the HistogramVisible property on True ( by default, it is False ). After setting the HistogramVisible property on True, the control shows a horizontal splitter in the bottom side of the control.
- Adjusts the height of the histogram view using the HistogramHeight property ( by default it is 0 ). After setting the HistogramHeight property on a value greater than 0, the control shows a the histogram view in the bottom side of the control.
- Changes the HistogramPattern
or/and HistogramColor property,
else no bars will be shown in the histogram. The HistogramPattern/HistogramColor
properties belong to a Bar object. For
instance the Chart.Bars("Task").HistogramPattern =
exPatternDot, specifies that the Task bars will be represented in the histogram
using the
exPatternDot pattern (
 )
)
The followings are optional properties that you can set in order to customize your histogram:
- The HistogramType property indicates the type of the histogram being displayed for a specified bar.
- Use the HistogramView property to specify the items being represented in the histogram view. By default, only visible items are displayed in the histogram. For instance, using the HistogramView property you can select the items being represented in the histogram
- Use the HistogramBackColor property to specify the histogram's background color.
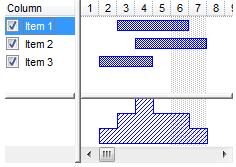
The following screen shot shows the histogram for all items ( as they are all checked in the first column ):
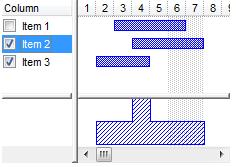
The following screen shot shows the histogram for the last 2 items ( Item 2, Item 3 as they are checked ):
The following VB sample shows the histogram for "Task" bars in the checked items:
With G2antt1
	.BeginUpdate
	With .Chart
		.FirstVisibleDate = #1/1/2001#
		.HistogramVisible = True
		.HistogramView = exHistogramCheckedItems
		.HistogramHeight = 32
		.Bars.Item("Task").HistogramPattern = exPatternBDiagonal
	End With
	.Columns.Add("Column").Def(exCellHasCheckBox) = True
	With .Items
		.AddBar .AddItem("Item 1"),"Task",#1/3/2001#,#1/5/2001#
		h = .AddItem("Item 2")
		.AddBar h,"Task",#1/4/2001#,#1/7/2001#
		.CellState(h,0) = 1
		h = .AddItem("Item 3")
		.AddBar h,"Task",#1/2/2001#,#1/5/2001#
		.CellState(h,0) = 1
	End With
	.EndUpdate
End With
The following VB.NET sample shows the histogram for "Task" bars in the checked items:
Dim h
With AxG2antt1
	.BeginUpdate
	With .Chart
		.FirstVisibleDate = #1/1/2001#
		.HistogramVisible = True
		.HistogramView = EXG2ANTTLib.HistogramViewEnum.exHistogramCheckedItems
		.HistogramHeight = 32
		.Bars.Item("Task").HistogramPattern = EXG2ANTTLib.PatternEnum.exPatternBDiagonal
	End With
	.Columns.Add("Column").Def(EXG2ANTTLib.DefColumnEnum.exCellHasCheckBox) = True
	With .Items
		.AddBar .AddItem("Item 1"),"Task",#1/3/2001#,#1/5/2001#
		h = .AddItem("Item 2")
		.AddBar h,"Task",#1/4/2001#,#1/7/2001#
		.CellState(h,0) = 1
		h = .AddItem("Item 3")
		.AddBar h,"Task",#1/2/2001#,#1/5/2001#
		.CellState(h,0) = 1
	End With
	.EndUpdate
End With
The following C# sample shows the histogram for "Task" bars in the checked items:
axG2antt1.BeginUpdate();
EXG2ANTTLib.Chart var_Chart = axG2antt1.Chart;
	var_Chart.FirstVisibleDate = "1/1/2001";
	var_Chart.HistogramVisible = true;
	var_Chart.HistogramView = EXG2ANTTLib.HistogramViewEnum.exHistogramCheckedItems;
	var_Chart.HistogramHeight = 32;
	var_Chart.Bars["Task"].HistogramPattern = EXG2ANTTLib.PatternEnum.exPatternBDiagonal;
(axG2antt1.Columns.Add("Column") as EXG2ANTTLib.Column).set_Def(EXG2ANTTLib.DefColumnEnum.exCellHasCheckBox,true);
EXG2ANTTLib.Items var_Items = axG2antt1.Items;
	var_Items.AddBar(var_Items.AddItem("Item 1"),"Task","1/3/2001","1/5/2001",null,null);
	int h = var_Items.AddItem("Item 2");
	var_Items.AddBar(h,"Task","1/4/2001","1/7/2001",null,null);
	var_Items.set_CellState(h,0,1);
	h = var_Items.AddItem("Item 3");
	var_Items.AddBar(h,"Task","1/2/2001","1/5/2001",null,null);
	var_Items.set_CellState(h,0,1);
axG2antt1.EndUpdate();
The following C++ sample shows the histogram for "Task" bars in the checked items:
/*
	Copy and paste the following directives to your header file as
	it defines the namespace 'EXG2ANTTLib' for the library: 'ExG2antt 1.0 Control Library'

	#import "D:\\Windows\\System32\\ExG2antt.dll"
	using namespace EXG2ANTTLib;
*/
EXG2ANTTLib::IG2anttPtr spG2antt1 = GetDlgItem(IDC_G2ANTT1)->GetControlUnknown();
spG2antt1->BeginUpdate();
EXG2ANTTLib::IChartPtr var_Chart = spG2antt1->GetChart();
	var_Chart->PutFirstVisibleDate("1/1/2001");
	var_Chart->PutHistogramVisible(VARIANT_TRUE);
	var_Chart->PutHistogramView(EXG2ANTTLib::exHistogramCheckedItems);
	var_Chart->PutHistogramHeight(32);
	var_Chart->GetBars()->GetItem("Task")->PutHistogramPattern(EXG2ANTTLib::exPatternBDiagonal);
((EXG2ANTTLib::IColumnPtr)(spG2antt1->GetColumns()->Add(L"Column")))->PutDef(EXG2ANTTLib::exCellHasCheckBox,VARIANT_TRUE);
EXG2ANTTLib::IItemsPtr var_Items = spG2antt1->GetItems();
	var_Items->AddBar(var_Items->AddItem("Item 1"),"Task","1/3/2001","1/5/2001",vtMissing,vtMissing);
	long h = var_Items->AddItem("Item 2");
	var_Items->AddBar(h,"Task","1/4/2001","1/7/2001",vtMissing,vtMissing);
	var_Items->PutCellState(h,long(0),1);
	h = var_Items->AddItem("Item 3");
	var_Items->AddBar(h,"Task","1/2/2001","1/5/2001",vtMissing,vtMissing);
	var_Items->PutCellState(h,long(0),1);
spG2antt1->EndUpdate();
The following VFP sample shows the histogram for "Task" bars in the checked items:
with thisform.G2antt1
	.BeginUpdate
	with .Chart
		.FirstVisibleDate = {^2001-1-1}
		.HistogramVisible = .T.
		.HistogramView = 4
		.HistogramHeight = 32
		.Bars.Item("Task").HistogramPattern = 6
	endwith
	.Columns.Add("Column").Def(0) = .T.
	with .Items
		.AddBar(.AddItem("Item 1"),"Task",{^2001-1-3},{^2001-1-5})
		h = .AddItem("Item 2")
		.AddBar(h,"Task",{^2001-1-4},{^2001-1-7})
		.CellState(h,0) = 1
		h = .AddItem("Item 3")
		.AddBar(h,"Task",{^2001-1-2},{^2001-1-5})
		.CellState(h,0) = 1
	endwith
	.EndUpdate
endwith