property Chart.HistogramValueFromPoint (X as OLE_XPOS_PIXELS, Y as OLE_YPOS_PIXELS) as Double
Retrieves the value from the histogram at the cursor position.

TypeDescription
X as OLE_XPOS_PIXELS A single that specifies the current X location of the mouse pointer. The x values is always expressed in client coordinates.
Y as OLE_YPOS_PIXELS A single that specifies the current Y location of the mouse pointer. The y values is always expressed in client coordinates.
Double A double expression that specifies the value in the histogram from the specified position.
Use the HistogramValueFromPoint property to determine the value from the specified position in the histogram. The HistogramValueFromPoint property works only if the ShowHistogramValues property is a not-empty and a valid expression. If the returned value is different than 0 you can use the ShowToolTip property to display your customized tooltip. The DateFromPoint property determines the date expression from the point. The HistogramVisible property specifies whether the chart shows the histogram for selected bars. The ShowHistogramValues property specifies the formula that returns the color to display the selected values in the histogram for specified type of bar.

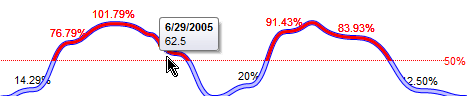
The following screen shows shows a tooltip as the user moves the cursor over the chart's histogram: