property Bar.HistogramRulerLinesColor as Color
Retrieves or sets a value that indicates the color to show the histogram's ruler lines.

TypeDescription
Color A Color expression that specifies the color to show the ruler. Use the value on 1, incase you actually need a black ruler lines color.
By default, the HistogramRulerLinesColor property is 0, which means that it has no effect. The left side of the histogram displays rulers based on the HistogramType property. If the HistogramType property is exOverload, the ruler displays numbers, while if the HistogramType property is exOverAllocation displays percents. The HistogramGridLinesColor property to specify the color to show the grid lines in the right side of the histogram, when the HistogramType property is exOverload. Use the HistogramBoundsChanged event to notify your application when the left part of the histogram is resized, so inside controls must be re-positioned. You can always use the BeforeDrawPart/AfterDrawPart events to provide your custom drawing in the histogram. The ShowHistogramValues property specifies the formula that returns the color to display the selected values in the histogram for specified type of bar.

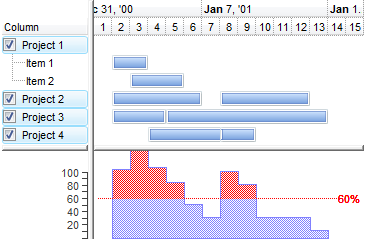
The left part of the histogram shows the rulers as in the following screen shot:

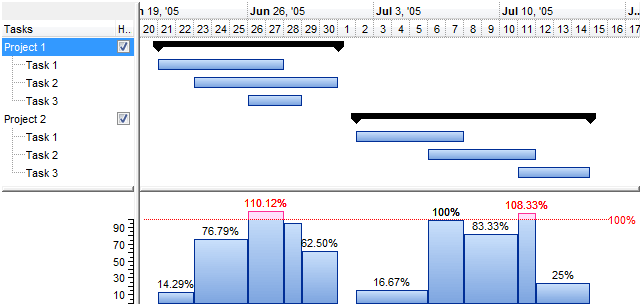
The left part of the histogram shows the rulers, while the right side of the histogram shows the values as in the following screen shot: