private void HistogramBoundsChanged(object sender,int X,int Y,int Width,int Height)
{
}
Private Sub HistogramBoundsChanged(ByVal sender As System.Object,ByVal X As Integer,ByVal Y As Integer,ByVal Width As Integer,ByVal Height As Integer) Handles HistogramBoundsChanged End Sub |
Syntax for HistogramBoundsChanged event, /COM version, on:
private void HistogramBoundsChanged(object sender, AxEXG2ANTTLib._IG2anttEvents_HistogramBoundsChangedEvent e)
{
}
void OnHistogramBoundsChanged(long X,long Y,long Width,long Height)
{
}
void __fastcall HistogramBoundsChanged(TObject *Sender,long X,long Y,long Width,long Height)
{
}
procedure HistogramBoundsChanged(ASender: TObject; X : Integer;Y : Integer;Width : Integer;Height : Integer); begin end; procedure HistogramBoundsChanged(sender: System.Object; e: AxEXG2ANTTLib._IG2anttEvents_HistogramBoundsChangedEvent); begin end; begin event HistogramBoundsChanged(long X,long Y,long Width,long Height) end event HistogramBoundsChanged Private Sub HistogramBoundsChanged(ByVal sender As System.Object, ByVal e As AxEXG2ANTTLib._IG2anttEvents_HistogramBoundsChangedEvent) Handles HistogramBoundsChanged End Sub Private Sub HistogramBoundsChanged(ByVal X As Long,ByVal Y As Long,ByVal Width As Long,ByVal Height As Long) End Sub Private Sub HistogramBoundsChanged(ByVal X As Long,ByVal Y As Long,ByVal Width As Long,ByVal Height As Long) End Sub LPARAMETERS X,Y,Width,Height PROCEDURE OnHistogramBoundsChanged(oG2antt,X,Y,Width,Height) RETURN |
Syntax for HistogramBoundsChanged event, /COM version (others), on:
<SCRIPT EVENT="HistogramBoundsChanged(X,Y,Width,Height)" LANGUAGE="JScript"> </SCRIPT> <SCRIPT LANGUAGE="VBScript"> Function HistogramBoundsChanged(X,Y,Width,Height) End Function </SCRIPT> Procedure OnComHistogramBoundsChanged Integer llX Integer llY Integer llWidth Integer llHeight Forward Send OnComHistogramBoundsChanged llX llY llWidth llHeight End_Procedure METHOD OCX_HistogramBoundsChanged(X,Y,Width,Height) CLASS MainDialog RETURN NIL void onEvent_HistogramBoundsChanged(int _X,int _Y,int _Width,int _Height)
{
}
function HistogramBoundsChanged as v (X as N,Y as N,Width as N,Height as N) end function function nativeObject_HistogramBoundsChanged(X,Y,Width,Height) return |
For instance, you can use the Controls property of the /NET assembly to add new components inside the control, and using the HistogramBoundsChanged event you can control it so they will be displayed in the left part of the chart's histogram as show in the following screen shot:
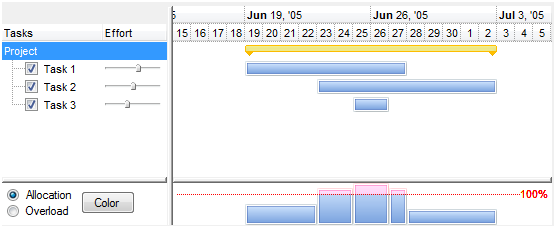
The "Allocation/Overload, Color" panel is being added as a Panel component that belongs to the form, as shown in the following screen shot:
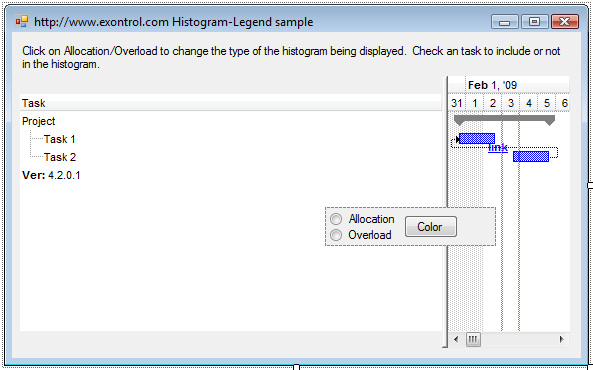
You can define your legend for the histogram by doing the following:
-
Add a Panel component to the form, in case you require multiple components being displayed in the chart's histogram.
-
Add all components to the panel, that you might want to use in the histogram.
-
Call the exgantt1.Controls.Add method to add the newly panel/ component as being a child of the control.
-
Handle the HistogramBoundsChanged event so you update the location and the size of the panel, with the new coordinates as follows:
private void exg2antt1_HistogramBoundsChanged(object sender, Rectangle Bounds)
{
    panel1.Bounds = Bounds;
}
A similar technique can be used for environment such as VB6/C++/eDeveloper/Clarion using the SetParent and SetWindowPos API functions as follow:
- Add a control or a collection of controls to the same form where the control is hosted. In our sample we will add another g2antt control named G2antt2
- Add API declarations as
Private Declare Function SetParent Lib "user32" (ByVal hWndChild As Long, ByVal hWndNewParent As Long) As Long
Private Declare Function SetWindowPos Lib "user32" (ByVal hwnd As Long, ByVal hWndInsertAfter As Long, ByVal x As Long, ByVal y As Long, ByVal cx As Long, ByVal cy As Long, ByVal wFlags As Long) As Long
Private Const SWP_NOZORDER = &H4
Private Const SWP_SHOWWINDOW = &H40
- Handle the HistogramBoundsChanged event and add the code
Private Sub G2antt1_HistogramBoundsChanged(ByVal x As Long, ByVal y As Long, ByVal Width As Long, ByVal Height As Long)
On Error Resume Next
    With G2antt2
        Width = Width - 20
        SetWindowPos .hwnd, 0, x, y, Width, Height, SWP_NOZORDER Or SWP_SHOWWINDOW
        .Left = x * Screen.TwipsPerPixelX
        .Top = y * Screen.TwipsPerPixelY
        .Width = Width * Screen.TwipsPerPixelX
        .Height = Height * Screen.TwipsPerPixelY
    End With
End Sub
- Add the Form_load event as:
Private Sub Form_Load()
    With G2antt1
        .BeginUpdate
            SetParent G2antt2.hwnd, G2antt1.hwnd
            With .Chart
                .HistogramVisible = True
                .HistogramHeight = 134
            End With
        .EndUpdate
    End With
End Sub
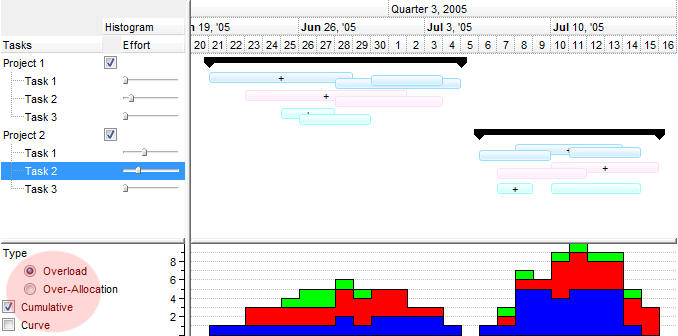
The sample changes the parent of the g2antt control to be the g2antt1 control and reposition the inside control. In the following screen shot the left side of the histogram is another eXG2antt control with the template:
BeginUpdate()
BackColor = RGB(255,255,255)
Appearance = 0
ScrollBars = 0
HeaderVisible = False
OnResizeControl = 128
Columns.Add("Diagram")
{
	AllowSort = False
	AllowDragging = False
}
Chart
{
	PaneWidth(1) = 0
	ScrollBar = False
}
SelBackColor = BackColor
SelForeColor = ForeColor
ShowFocusRect = False
HasLines = 0
Items
{
	Dim h, h1,h2
	h = AddItem("Type")
	h1 = InsertItem(h,,"Overload")
	CellHasRadioButton(h1,0) = True
	CellState(h1,0) = 1
	CellRadioGroup(h1,0) = 1234
	h1 = InsertItem(h,,"Over-Allocation")
	CellHasRadioButton(h1,0) = True
	CellRadioGroup(h1,0) = 1234
	ExpandItem(h) = True
	h = AddItem("Cumulative")
	CellHasCheckBox(h,0) = 1
	h = AddItem("Curve")
	CellHasCheckBox(h,0) = 1
}
EndUpdate()
The following screen shot shows in red the inside eXG2antt control being placed in the left part of the histogram.