|
232
|
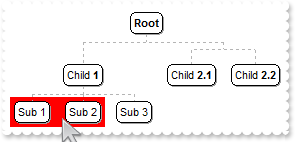
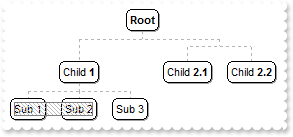
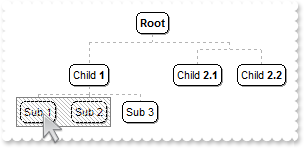
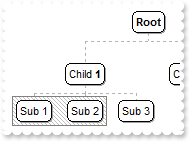
How can I replace or add an icon at runtime
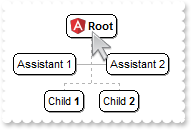
OBJECT chartview,node,nodes;

chartview =  ObjectByName("AN1") ;
_ObjectCallMethod( chartview , "ReplaceIcon", "gAAAABgYACEHgUJFEEAAWhUJCEJEEJggEhMCYEXjUbjkJQECj8gj8hAEjkshYEpk8kf8ClsulsvAExmcvf83js5nU7nkCeEcn8boMaocXosCB9Hn09pkzcEuoL/fE+O" +
	"kYB0gB9YhIHrddgVcr9aktZADAD8+P8CgIA==");
_ObjectCallMethod( chartview , "ReplaceIcon", "C:\images\favicon.ico",0);
node = _ObjectGetProperty( chartview , "Root");
	_ObjectSetProperty( node , "Image", 1);
	_ObjectCallMethod( node , "AddAssistant", "Assistant 1");
	_ObjectCallMethod( node , "AddAssistant", "Assistant 2");
nodes = _ObjectGetProperty( chartview , "Nodes");
	_ObjectSetProperty( _ObjectCallMethod( nodes , "Add", "Child <b>1</b>","","1234") , "Expanded", 0);
	_ObjectCallMethod( nodes , "Add", "Sub 1","1234");
	_ObjectCallMethod( nodes , "Add", "Sub 2","1234");
	_ObjectCallMethod( nodes , "Add", "Sub 3","1234");
	_ObjectCallMethod( nodes , "Add", "Child <b>2</b>");
|
|
231
|
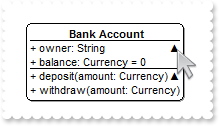
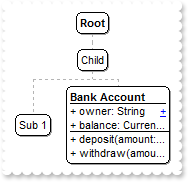
Expandable-caption
// AnchorClick event - Occurs when an anchor element is clicked.
FUNCTION chartviewEvents_AnchorClick(OBJECT chartview, STRING AnchorID, STRING Options)
	Message( AnchorID );
END

OBJECT chartview,node;

chartview =  ObjectByName("AN1") ;
ObjectAssociateEvents("chartviewEvents", chartview);
node = _ObjectGetProperty( chartview , "Root");
	_ObjectSetProperty( node , "CaptionSingleLine", 1);
	_ObjectSetProperty( node , "Caption", "<solidline> <c><b>Bank Account</b></solidline><br>+ owner: String <r><a 1;e64=gA8ABzABvABsABpABkg8JABuABlAA+AAgAECMcTi4AMwAM4Aj" +
	"MGhEGOUVAA4AAwk8plcqihwAElg0wiUlOkOiUEgQvgcFhsKhkIhUQiUUnccj0gn0jmMagUlowAMNOpEfkMNkkmlEqrctjQmAAjAA5AA2sssHcbnkdq1Ln1QtVSjQAAEB" +
	"A==>▲</a><br><solidline>+ balance: Currency = 0</solidline><br>+ deposit(amount: Currency)<r><a 2;e64=gA8ABjAA+AECMwAM8DAB" +
	"vABshoAOQAEAAHAAGEWjEajMGNoAMoAOgANERMgAOcHAAvAEJhcEh0Qh0Tg0CmkqMMFlUuhkxiMTisXjNCjk6EwAEYAHIAG1MjY7lUsnkwh8/nUClk5gwAAEBA==>	" +
	"650;</a><br>+ withdraw(amount: Currency)");
|
|
230
|
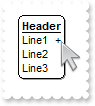
Expandable-caption
OBJECT chartview,node;

chartview =  ObjectByName("AN1") ;
node = _ObjectGetProperty( chartview , "Root");
	_ObjectSetProperty( node , "CaptionSingleLine", 1);
	_ObjectSetProperty( node , "Caption", "<solidline><b>Header</b></solidline><br>Line1<r><a ;exp=show lines>+</a><br>Line2<br>Line3");
|
|
229
|
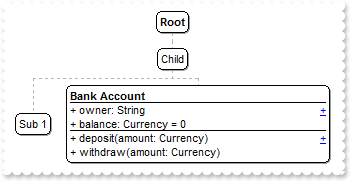
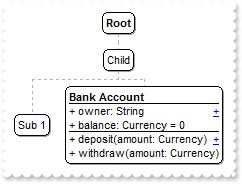
Fullfit the caption on the element's width
// AnchorClick event - Occurs when an anchor element is clicked.
FUNCTION chartviewEvents_AnchorClick(OBJECT chartview, STRING AnchorID, STRING Options)
	Message( AnchorID );
END

OBJECT chartview,node,nodes;

chartview =  ObjectByName("AN1") ;
ObjectAssociateEvents("chartviewEvents", chartview);
_ObjectSetProperty( chartview , "AllowSelectNothing", -1);
_ObjectSetProperty( chartview , "AllowEdit", 0);
nodes = _ObjectGetProperty( chartview , "Nodes");
	_ObjectCallMethod( nodes , "Add", "Child","","1234");
	_ObjectCallMethod( nodes , "Add", "Sub 1","1234");
	node = _ObjectCallMethod( nodes , "Add", "Sub 2","1234");
		_ObjectSetProperty( node , "FixedWidth", 256);
		_ObjectSetProperty( node , "CaptionSingleLine", 1);
		_ObjectSetProperty( node , "Caption", "<solidline><b>Bank Account</b></solidline><br>+ owner: String <r><a 1;properties>+</a><br><solidline>+ balance: Currency = 0</s" +
	"olidline><br>+ deposit(amount: Currency)<r><a 2;methods>+</a><br>+ withdraw(amount: Currency)");
|
|
228
|
Break-wrap the caption (truncated)
// AnchorClick event - Occurs when an anchor element is clicked.
FUNCTION chartviewEvents_AnchorClick(OBJECT chartview, STRING AnchorID, STRING Options)
	Message( AnchorID );
END

OBJECT chartview,node,nodes;

chartview =  ObjectByName("AN1") ;
ObjectAssociateEvents("chartviewEvents", chartview);
_ObjectSetProperty( chartview , "AllowSelectNothing", -1);
_ObjectSetProperty( chartview , "AllowEdit", 0);
nodes = _ObjectGetProperty( chartview , "Nodes");
	_ObjectCallMethod( nodes , "Add", "Child","","1234");
	_ObjectCallMethod( nodes , "Add", "Sub 1","1234");
	node = _ObjectCallMethod( nodes , "Add", "Sub 2","1234");
		_ObjectSetProperty( node , "FixedWidth", 96);
		_ObjectSetProperty( node , "CaptionSingleLine", 1);
		_ObjectSetProperty( node , "Caption", "<solidline><b>Bank Account</b></solidline><br>+ owner: String <r><a 1;properties>+</a><br><solidline>+ balance: Currency = 0</s" +
	"olidline><br>+ deposit(amount: Currency)<r><a 2;methods>+</a><br>+ withdraw(amount: Currency)");
|
|
227
|
Break-wrap the caption
OBJECT chartview,node,nodes;

chartview =  ObjectByName("AN1") ;
_ObjectSetProperty( chartview , "AllowSelectNothing", -1);
nodes = _ObjectGetProperty( chartview , "Nodes");
	_ObjectCallMethod( nodes , "Add", "Child","","1234");
	_ObjectCallMethod( nodes , "Add", "Sub 1","1234");
	node = _ObjectCallMethod( nodes , "Add", "Sub 2","1234");
		_ObjectSetProperty( node , "CaptionSingleLine", 1);
		_ObjectSetProperty( node , "Caption", "<solidline><b>Bank Account</b></solidline><br>+ owner: String <r><a 1;properties>+</a><br><solidline>+ balance: Currency = 0</s" +
	"olidline><br>+ deposit(amount: Currency)<r><a 2;methods>+</a><br>+ withdraw(amount: Currency)");
|
|
226
|
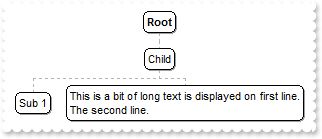
Wrap the caption by <br> or "\r\n" sequence only
OBJECT chartview,node,nodes;

chartview =  ObjectByName("AN1") ;
nodes = _ObjectGetProperty( chartview , "Nodes");
	_ObjectCallMethod( nodes , "Add", "Child","","1234");
	_ObjectCallMethod( nodes , "Add", "Sub 1","1234");
	node = _ObjectCallMethod( nodes , "Add", "Sub 2","1234");
		_ObjectSetProperty( node , "CaptionSingleLine", 1);
		_ObjectSetProperty( node , "Caption", "This is a bit of long text is displayed on first line.<br>The second line.");
|
|
225
|
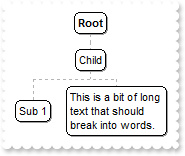
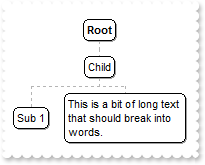
Word-wrap the caption (specify the width to wrap)
OBJECT chartview,node,nodes;

chartview =  ObjectByName("AN1") ;
nodes = _ObjectGetProperty( chartview , "Nodes");
	_ObjectCallMethod( nodes , "Add", "Child","","1234");
	_ObjectCallMethod( nodes , "Add", "Sub 1","1234");
	node = _ObjectCallMethod( nodes , "Add", "Sub 2","1234");
		_ObjectSetProperty( node , "Width", 96);
		_ObjectSetProperty( node , "CaptionSingleLine", 0);
		_ObjectSetProperty( node , "Caption", "This is a bit of long text that should break into words.");
|
|
224
|
Word-wrap the caption
OBJECT chartview,node,nodes;

chartview =  ObjectByName("AN1") ;
nodes = _ObjectGetProperty( chartview , "Nodes");
	_ObjectCallMethod( nodes , "Add", "Child","","1234");
	_ObjectCallMethod( nodes , "Add", "Sub 1","1234");
	node = _ObjectCallMethod( nodes , "Add", "Sub 2","1234");
		_ObjectSetProperty( node , "CaptionSingleLine", 0);
		_ObjectSetProperty( node , "Caption", "This is a bit of long text that should break into words.");
|
|
223
|
Caption on a single line (truncated)
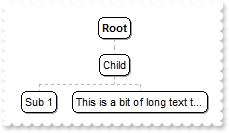
OBJECT chartview,node,nodes;

chartview =  ObjectByName("AN1") ;
nodes = _ObjectGetProperty( chartview , "Nodes");
	_ObjectCallMethod( nodes , "Add", "Child","","1234");
	_ObjectCallMethod( nodes , "Add", "Sub 1","1234");
	node = _ObjectCallMethod( nodes , "Add", "Sub 2","1234");
		_ObjectSetProperty( node , "CaptionSingleLine", -1);
		_ObjectSetProperty( node , "Caption", "This is a bit of long text that should be truncated.");
		_ObjectSetProperty( node , "FixedWidth", 128);
|
|
222
|
Caption on a single line
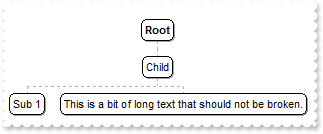
OBJECT chartview,node,nodes;

chartview =  ObjectByName("AN1") ;
nodes = _ObjectGetProperty( chartview , "Nodes");
	_ObjectCallMethod( nodes , "Add", "Child","","1234");
	_ObjectCallMethod( nodes , "Add", "Sub 1","1234");
	node = _ObjectCallMethod( nodes , "Add", "Sub 2","1234");
		_ObjectSetProperty( node , "CaptionSingleLine", -1);
		_ObjectSetProperty( node , "Caption", "This is a bit of long text that should not be broken.");
|
|
221
|
Force hover-all feature
OBJECT chartview;

chartview =  ObjectByName("AN1") ;
_ObjectCallMethod(chartview, "ExecuteTemplate", "Background(500) = -1");
|
|
220
|
Disable hover-all feature (Windows 11 or greater)
OBJECT chartview;

chartview =  ObjectByName("AN1") ;
_ObjectCallMethod(chartview, "ExecuteTemplate", "Background(500) = 1");
|
|
219
|
Display a custom tooltip
// MouseMove event - Occurs when the user moves the mouse.
FUNCTION chartviewEvents_MouseMove(OBJECT chartview, INT Button, INT Shift, INT X, INT Y)
	_ObjectCallMethod( chartview , "ShowToolTip", "new content","","","+8","+8");
END
|
|
218
|
Shows the tooltip of the object moved relative to its default position
// MouseMove event - Occurs when the user moves the mouse.
FUNCTION chartviewEvents_MouseMove(OBJECT chartview, INT Button, INT Shift, INT X, INT Y)
	_ObjectCallMethod( chartview , "ShowToolTip", "<null>","<null>","","+8","+8");
END

OBJECT chartview;

chartview =  ObjectByName("AN1") ;
ObjectAssociateEvents("chartviewEvents", chartview);
_ObjectSetProperty( _ObjectGetProperty( chartview , "Root") , "ToolTip", "This is a bit of text that's shown when the cursor hovers the node.");
|
|
217
|
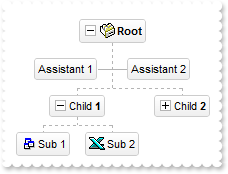
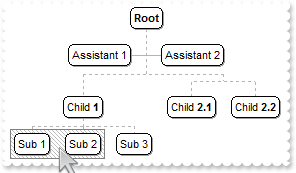
ImageSize property on 32 (specifies the size of control' icons/images/check-boxes/radio-buttons)
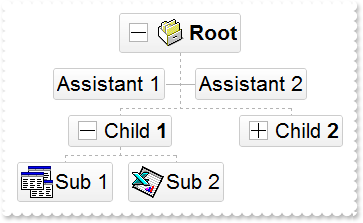
OBJECT appearance,chartview,node,nodes;

chartview =  ObjectByName("AN1") ;
_ObjectCallMethod( chartview , "BeginUpdate");
_ObjectSetProperty( chartview , "ImageSize", 32);
_ObjectSetProperty( _ObjectGetProperty( chartview , "Font") , "Size", 16);
_ObjectCallMethod( chartview , "Images", "gBJJgBAIDAAEg4AEEKAD/hz/EMNh8TIRNGwAjEZAEXjAojKAjMLjABhkaABAk0plUrlktl0vmExmUzmk1m03nE5nU7nk9miAoE+oVDolFo1HpFJpU5h8Sf9OqFNqUOq" +
	"NUqdPq9VrFWrlbr1QpdhAFAkFis1ntFptVrtkrpszrNvmVxqk3uVtm1kmF3sdBvF/wGBmV+j9BYGHwWJulfxdax2NyFdx2JlV6l9Nw7AAGZymdz2Cy2GxErvWcz9ivlw" +
	"yV21cuxugwktzGIzmvwtl0+53U5y0a0Wazmmyu/3dCyOMyXHx/J5nIr9q3uyqnBxFN3G46ma4vb7mD2Ng4nZze00fDkHC7t7us2rOX5tguetpHRlmz4HVqnXk1PjHO+C" +
	"MPo9MBMC+j2vC8j7wS8cFNI4kBo05UIvfCT/NsnsApU+0Fqg/T+oy/kPxC0sEQfErKQK96+w28UWRI8UGvO8sTLS9r2PWmsMJTDTask3CsIbIEQRA3shOXEEAO/GclJ9" +
	"FEKrrA8FRbKMXRIlb0JxCkjS1LMswhCcvuel0cv26cSMa8Ufx+2sQwhEUoSXOCjSbLcnxjKc7sdKUVyq28NtVI71P9P7JxtQEapjQ6fzfM8zPfNE2PhIsLL63E40slk5" +
	"y7N89LcyU9SvMb3SdUc6VJLj5VLVLfO/PS9KzNFHUa/0XyBD0dxlS9cxhMlTRSoNXypPErWDPyfNS+MwprRNO0FD8wVVZ1AI08URwVRjtJ1WCn21QkkUrXVLVPQS/XIk" +
	"FgTxT9iONZ9xVTdq+L1eKg3kkF6Upe68XtfV51/MtrVjBlwYFL1ev8y1/P6/lyzzYl02wntj0RVFmS1Qa+M5as93QxEUW9e993rfmQ2+vy65M/mL1lhl/2bj2ByVduMt" +
	"NhCJT9hdz41nN14Ld12Z9UjfI/oUAaGseiw6+uFLLhcVabJOS5RqOE0BHlZ5VnEr5fOMs3st+aa/bbRzrJGV51Y0b0DbqaWXZD90hIsPbjWu52+6Wyadpe66hhO+P/Xi" +
	"oW5rD8ZbrUZuVg6n1dsE/cXmewu1m9PVwnd35/nueXho/NaJzmjc61W76esuT77eG8pTquy9TwWH8LEzG8RDfFalx3Gcfvna9rvG/cptGLd9tuI6TZOP5Fiqi99vea+X" +
	"4VRcBq/JZZtVQ9cwSs5lsXE372+a9z7PbfB3VVqHyvMctLto8uob6eV0m/cD6MN2v+T33t6sBut42vdv2bJ8a997x2maFJfK+qArbGJPEKE+1qTflMsIdW/GCJX17KcT" +
	"6/czr/X+u1g29B7j/4BQfWkkx4zIHisjhPCmE0K4SwtXM+d4BvHRwNZOoBph9IJvPek9d40FoMJxf691jj2ywQQcHEWET4XJwkTszlVqm2GokewxtBT1DpQjRxDN0rUV" +
	"DNKdC3lb6tzNOwh6upMSSYfv4YBCl/bsn9PxiFCEo7SI6Obc9HeOrnY8x4jtHtdpN4GRbaorhsbu18Pph5CiHymI0RpSXGJ/z2oUOxYxG858AyiI+bfJtuTcG5yelBJy" +
	"T8okhqFd4a5yxL0rvulYtKCsZiWxWkc1s1cRoxxwhA31DLE0mR9l9HqX8fJgTDmFMVH0MIsRzVYnwnMi1dyzmhLt2kS2pxIiU62Wj5ptQGlSYFakLonTUJNLKaM5Wzlf" +
	"fEkuFkk5wTrhVO2eE7G6lJhxFFYUZ55zmn0WuBCD4pzhirFCKkbomsOoIYmZx5p90LoYWGPdD5g0QmJRKYxbZ6zYoVQ2jVGylSak7KSkFH6RSjpHKFuU+YMyNo5SulkC" +
	"6I0vonTCitMXPoEpVS2H5FQfEqp2R1opIgAEkJISYARTCukOhmPNI5Ex/wzGHUsicMwA1LHgQ90Y/KpoQHAD+pB/R4NzIaMAB9Xaw1gqaAOsh/A/ptIkWUfhGK1kZH8R" +
	"gH5GqvgArqRmt4AAPrTroRofBGADkqr6Rmu4D7CEaHARiwpJrEEZsXXwlVjyMWRsaRqwdkLGNBABZmytmyMnaINZqyVpLR2ftKAAAdd6h2osbaskdiq4EZtgSmyNcbVW" +
	"RJNXe3AA7REar3b0stlAAXBtoRmvJGLjEYAHUWsFcwCD/rnaop9aEICMAPdK5hT6xpeuzdOtAgKuJeGfdq6ggEbkTvAP+p9UCHXrvKkcgIA==");
appearance = _ObjectGetProperty( chartview , "VisualAppearance");
	_ObjectCallMethod( appearance , "Add", 4,"gBFLBCJwBAEHhEJAAEhABUYCg6AADACAxRDgMQBQKAAzQFAYbhkGCGAAGMZxRgmFgAQhFcZQSKUOQTDKMIziYBYfgkMIgSbJUgDGAkRRdDSOYDmGQYDiCIoRShOMIjH" +
	"LUXxtDaIZwhEAoJb+RgAUY/cTzaAEUwHHiTKInaCQShsFYJUJAdRURQ9EwvCIZBpEWwLChENQwWLCNj2TScBwjCyqbale45ViqdoDU5EUiXJJ8ZxnECfYyrGjaMpCeKB" +
	"UrGYTVRBIMxLLSia5oeJqMrnBpNVrIUgXCAGFwHK6BcauXIIDp6XoWWRbAAWDpVVzNNC3YzkCIceADHKiXxmVz4JLdGZ1QTGID2XaYaxWK4oZjsVSc4KDHbETbHFi9Fo" +
	"3NaaxGisew+GYc4HlCR5NAAAIIEkQJSGMOgdE4RhYDwJJsAaAYQgmPpolCWgSCiBJzjcEIAkQXIBm8d5UhOQgCDUIBDDJDhgggJgKgKYJIDSVoDk8KBFF4OohEMZgWDs" +
	"YYDj4GoGmGSB2B6B5iAiBgYDsYRjGSbIJo4RgqDuIpIAoLoLmMCJGDKDJjJiLA7xqUAAgGTwYnYPoPmQCQGEKEJkEkFg9gGY44BoRoSmSSQ2EKEggHgRhShSZRJFYVoV" +
	"mWCRmFKFAgGOTheheZgJgYYoYmYSYWGaF4lkMMJ0hqZpJjYbobmcCZGHKHJmjmJh0h2Z4JmYcIaE8WZ2H6H5oAoBoCiCaBKBYfdjGoJoKiKaJKDaDojmkChGgmIgpCoV" +
	"oWiWaJZiSd4mmmSh2h6J5qAqBoiiiaY5iSeIpmqComiqKpqkqNouiuah6hqMIsmsSpWiuGhP1kOoumuSp2j6L5sAsBo54gKwWkaMZsgsJpKjKbJLDaRYxYWRpSjSbIZi" +
	"Se41m2CxmlqNptksdpejebR5iSfI4m4S4W16boLiaao6m5fJ9jubwLkaco8m8S5WnaPZunuOp4j6b5Lnac4SA0PAGlgP4wEwFwGkGcIMCcCpCnCCxiA8NYAAmMJfkSbh" +
	"FCcFpFnGDBnBqRpUhuEwTDeZ5lHCfw6HIQxLCaAxygyJwqgGcATE4FA6hWY4tjEAAQBAgIA==");
_ObjectCallMethod(chartview, "ExecuteTemplate", "Background(0) = 67108864");
_ObjectSetProperty( chartview , "HasButtons", -1);
node = _ObjectGetProperty( chartview , "Root");
	_ObjectSetProperty( node , "Image", 1);
	_ObjectCallMethod( node , "AddAssistant", "Assistant 1");
	_ObjectCallMethod( node , "AddAssistant", "Assistant 2");
nodes = _ObjectGetProperty( chartview , "Nodes");
	_ObjectCallMethod( nodes , "Add", "Child <b>1</b>","","1234");
	_ObjectSetProperty( _ObjectCallMethod( nodes , "Add", "Sub 1","1234") , "Image", 2);
	_ObjectSetProperty( _ObjectCallMethod( nodes , "Add", "Sub 2","1234") , "Image", 3);
	_ObjectSetProperty( _ObjectCallMethod( nodes , "Add", "Child <b>2</b>","","1235") , "Expanded", 0);
	_ObjectCallMethod( nodes , "Add", "Sub 2","1235");
_ObjectCallMethod( chartview , "EndUpdate");
|
|
216
|
ImageSize property on 16 (default) (specifies the size of control' icons/images/check-boxes/radio-buttons)
OBJECT appearance,chartview,node,nodes;

chartview =  ObjectByName("AN1") ;
_ObjectCallMethod( chartview , "BeginUpdate");
_ObjectSetProperty( chartview , "ImageSize", 16);
_ObjectCallMethod( chartview , "Images", "gBJJgBAIDAAEg4ACEKAD/hz/EMNh8TIRNGwAjEZAEXjAojJAjMLjABAAgjUYkUnlUrlktl0vmExmUzmk1m03nE5nU7nkrQCAntBoVDolFo1HoM/ADAplLptImdMYFOq" +
	"dSqlXq1QrVbrlGpVWsFNrNdnNjsk7pQAtNroFnt0sh8Yr9iulTuNxs1Eu8OiT/vsnsNVutXlk/oGGtVKxGLxWNtsZtN8iUYuNvy0Zvd+xNYwdwvl4p870GCqc8vOeuVt" +
	"tmp1knyOayWVy+WzN/ze1wOElenm+12WUz/Bv2/3UyyWrzeutux2GSyGP2dQ33C1ur3GD3M4zUNzHdlWjq/E3nGzVpjWv4HA7fRy/Tv2IrN8rPW6nZ3ve7mUlfu20Z8a" +
	"cvQyb+vY9jasYoDwMm+LytVBDqKG3z8O3Cb8P+mkAuY9cCQ2uL4KaxDKvkp8RNLEjqugnrwQo/UWPzFyeQw5sNLZFENrI4kOqU66pw8uzmOKvTqNqjULJvGL1JO48GtT" +
	"GsbLdEL3scxLlyiw8dQeoUVxdLTtyKmUjwGlslRPJsnK1HbAKbKCrsQo8uQk/CeP44iaR/ATnTNPLvyxPU+z9P9AUDQVBowiofJXQ6Oo+kKMpIkjztE4TKn4P6JowfgP" +
	"nwD5/nAjB8AOeAPo0eAA1IAFH07UhAIMpYAVIYFHqBUhwVjV1S1EtQAHxW65V0AZwAeuQAnwB5gAPYViEDVhwAHTQBkCjB4gOhwDmCyhH0sACAg==");
appearance = _ObjectGetProperty( chartview , "VisualAppearance");
	_ObjectCallMethod( appearance , "Add", 4,"gBFLBCJwBAEHhEJAAEhABUYCg6AADACAxRDgMQBQKAAzQFAYbhkGCGAAGMZxRgmFgAQhFcZQSKUOQTDKMIziYBYfgkMIgSbJUgDGAkRRdDSOYDmGQYDiCIoRShOMIjH" +
	"LUXxtDaIZwhEAoJb+RgAUY/cTzaAEUwHHiTKInaCQShsFYJUJAdRURQ9EwvCIZBpEWwLChENQwWLCNj2TScBwjCyqbale45ViqdoDU5EUiXJJ8ZxnECfYyrGjaMpCeKB" +
	"UrGYTVRBIMxLLSia5oeJqMrnBpNVrIUgXCAGFwHK6BcauXIIDp6XoWWRbAAWDpVVzNNC3YzkCIceADHKiXxmVz4JLdGZ1QTGID2XaYaxWK4oZjsVSc4KDHbETbHFi9Fo" +
	"3NaaxGisew+GYc4HlCR5NAAAIIEkQJSGMOgdE4RhYDwJJsAaAYQgmPpolCWgSCiBJzjcEIAkQXIBm8d5UhOQgCDUIBDDJDhgggJgKgKYJIDSVoDk8KBFF4OohEMZgWDs" +
	"YYDj4GoGmGSB2B6B5iAiBgYDsYRjGSbIJo4RgqDuIpIAoLoLmMCJGDKDJjJiLA7xqUAAgGTwYnYPoPmQCQGEKEJkEkFg9gGY44BoRoSmSSQ2EKEggHgRhShSZRJFYVoV" +
	"mWCRmFKFAgGOTheheZgJgYYoYmYSYWGaF4lkMMJ0hqZpJjYbobmcCZGHKHJmjmJh0h2Z4JmYcIaE8WZ2H6H5oAoBoCiCaBKBYfdjGoJoKiKaJKDaDojmkChGgmIgpCoV" +
	"oWiWaJZiSd4mmmSh2h6J5qAqBoiiiaY5iSeIpmqComiqKpqkqNouiuah6hqMIsmsSpWiuGhP1kOoumuSp2j6L5sAsBo54gKwWkaMZsgsJpKjKbJLDaRYxYWRpSjSbIZi" +
	"Se41m2CxmlqNptksdpejebR5iSfI4m4S4W16boLiaao6m5fJ9jubwLkaco8m8S5WnaPZunuOp4j6b5Lnac4SA0PAGlgP4wEwFwGkGcIMCcCpCnCCxiA8NYAAmMJfkSbh" +
	"FCcFpFnGDBnBqRpUhuEwTDeZ5lHCfw6HIQxLCaAxygyJwqgGcATE4FA6hWY4tjEAAQBAgIA==");
_ObjectCallMethod(chartview, "ExecuteTemplate", "Background(0) = 67108864");
_ObjectSetProperty( chartview , "HasButtons", -1);
node = _ObjectGetProperty( chartview , "Root");
	_ObjectSetProperty( node , "Image", 1);
	_ObjectCallMethod( node , "AddAssistant", "Assistant 1");
	_ObjectCallMethod( node , "AddAssistant", "Assistant 2");
nodes = _ObjectGetProperty( chartview , "Nodes");
	_ObjectCallMethod( nodes , "Add", "Child <b>1</b>","","1234");
	_ObjectSetProperty( _ObjectCallMethod( nodes , "Add", "Sub 1","1234") , "Image", 2);
	_ObjectSetProperty( _ObjectCallMethod( nodes , "Add", "Sub 2","1234") , "Image", 3);
	_ObjectSetProperty( _ObjectCallMethod( nodes , "Add", "Child <b>2</b>","","1235") , "Expanded", 0);
	_ObjectCallMethod( nodes , "Add", "Sub 2","1235");
_ObjectCallMethod( chartview , "EndUpdate");
|
|
215
|
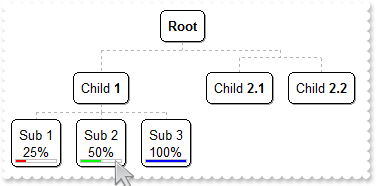
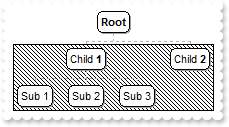
Is it possible to show a percent/progress-bar associated with a node (method 2)
OBJECT chartview,node,nodes;

chartview =  ObjectByName("AN1") ;
_ObjectCallMethod( chartview , "BeginUpdate");
_ObjectCallMethod(chartview, "ExecuteTemplate", "DefaultNodePadding(-1) = 4");
nodes = _ObjectGetProperty( chartview , "Nodes");
	_ObjectCallMethod( nodes , "Add", "Child <b>1</b>","","1234");
	_ObjectSetProperty( _ObjectCallMethod( nodes , "Add", "Sub 1<br>","1234","AK1") , "BackgroundExt", "none[(4,100%-22,100%-8,18)](bottom[4](left[10%,back=RGB(255,0,0)]),none[(0,100%-4,100%,4),pattern=0x000,frame=RGB(192,192,192)]" +
	",none[(2,100%-22,100%-4,22),text=`10%`,align=0x11]])");
	_ObjectSetProperty( _ObjectCallMethod( nodes , "Add", "Sub 2<br>","1234","AK2") , "BackgroundExt", "none[(4,100%-22,100%-8,18)](bottom[4](left[50%,back=RGB(0,255,0)]),none[(0,100%-4,100%,4),pattern=0x000,frame=RGB(192,192,192)]" +
	",none[(2,100%-22,100%-4,22),text=`50%`,align=0x11]])");
	_ObjectSetProperty( _ObjectCallMethod( nodes , "Add", "Sub 3<br>","1234","AK3") , "BackgroundExt", "none[(4,100%-22,100%-8,18)](bottom[4](left[100%,back=RGB(0,0,255)]),none[(0,100%-4,100%,4),pattern=0x000,frame=RGB(192,192,192)" +
	"],none[(2,100%-22,100%-4,22),text=`100%`,align=0x11]])");
	_ObjectCallMethod( _ObjectCallMethod( nodes , "Add", "Child <b>2.1</b>") , "AddGroup", "Child <b>2.2</b>");
node = _ObjectCallMethod(chartview, "ExecuteTemplate", "Nodes.Item(`AK1`)");
	_ObjectCallMethod(chartview, "TemplatePut", "Dim nodObj")
	_ObjectCallMethod(chartview, "TemplatePut", node)
	_ObjectCallMethod(chartview, "ExecuteTemplate", "nodObj.BackgroundExtValue(3,2) = `25%`");
	_ObjectCallMethod(chartview, "ExecuteTemplate", "nodObj.BackgroundExtValue(5,4) = BackgroundExtValue(3,2)");
_ObjectCallMethod( chartview , "EndUpdate");
|
|
214
|
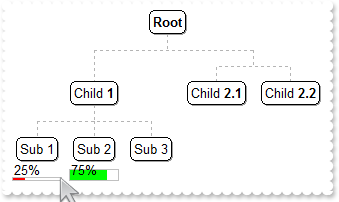
Is it possible to show a percent/progress-bar associated with a node (method 1)
OBJECT chartview,frame,nodes;

chartview =  ObjectByName("AN1") ;
_ObjectCallMethod( chartview , "BeginUpdate");
_ObjectSetProperty( chartview , "IndentSiblingY", 32);
nodes = _ObjectGetProperty( chartview , "Nodes");
	_ObjectCallMethod( nodes , "Add", "Child <b>1</b>","","1234");
	_ObjectCallMethod( nodes , "Add", "Sub 1","1234","AK1");
	_ObjectCallMethod( nodes , "Add", "Sub 2","1234","AK2");
	_ObjectCallMethod( nodes , "Add", "Sub 3","1234");
	_ObjectCallMethod( _ObjectCallMethod( nodes , "Add", "Child <b>2.1</b>") , "AddGroup", "Child <b>2.2</b>");
frame = _ObjectCallMethod( _ObjectGetProperty( chartview , "Frames") , "Add", "AK1");
	_ObjectSetProperty( _ObjectGetProperty( frame , "Pattern") , "Type", 0);
	_ObjectCallMethod(chartview, "TemplatePut", "Dim fraObj")
	_ObjectCallMethod(chartview, "TemplatePut", frame)
	_ObjectCallMethod(chartview, "ExecuteTemplate", "fraObj.Padding(3) = 20");
	_ObjectSetProperty( frame , "BackgroundExt", "bottom[4](left[50%,back=RGB(255,0,0)]),none[(0,100%-4,100%,4),pattern=0x000,frame=RGB(192,192,192)],none[(2,100%-22,100%-4,22)," +
	"text=`50%`]");
	f1 = _ObjectGetProperty( frame , "Index");
frame = _ObjectCallMethod(chartview, "ExecuteTemplate", "Frames.Item(f1)");
	_ObjectCallMethod(chartview, "ExecuteTemplate", "fraObj.BackgroundExtValue(2,2) = `25%`");
	_ObjectCallMethod(chartview, "ExecuteTemplate", "fraObj.BackgroundExtValue(4,4) = BackgroundExtValue(2,2)");
frame = _ObjectCallMethod( _ObjectGetProperty( chartview , "Frames") , "Add", "AK2");
	_ObjectSetProperty( _ObjectGetProperty( frame , "Pattern") , "Type", 0);
	_ObjectCallMethod(chartview, "ExecuteTemplate", "fraObj.Padding(3) = 20");
	_ObjectSetProperty( frame , "BackgroundExt", "bottom[12](left[50%,back=RGB(255,0,0)]),none[(0,100%-12,100%,12),pattern=0x000,frame=RGB(192,192,192)],none[(2,100%-22,100%-4,2" +
	"2),text=`50%`]");
	f2 = _ObjectGetProperty( frame , "Index");
frame = _ObjectCallMethod(chartview, "ExecuteTemplate", "Frames.Item(f2)");
	_ObjectCallMethod(chartview, "ExecuteTemplate", "fraObj.BackgroundExtValue(2,2) = `75%`");
	_ObjectCallMethod(chartview, "ExecuteTemplate", "fraObj.BackgroundExtValue(2,1) = 65280");
	_ObjectCallMethod(chartview, "ExecuteTemplate", "fraObj.BackgroundExtValue(4,4) = BackgroundExtValue(2,2)");
_ObjectCallMethod( chartview , "EndUpdate");
|
|
213
|
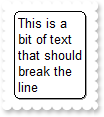
How can I display the node's caption on multiple lines
OBJECT chartview;

chartview =  ObjectByName("AN1") ;
_ObjectSetProperty( chartview , "WidthNode", 64);
_ObjectSetProperty( _ObjectGetProperty( chartview , "Root") , "Caption", "This is a bit of text that should break the line");
|
|
212
|
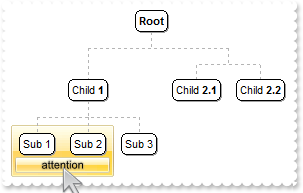
Is it possible to show some text/caption on the frame's background
OBJECT chartview,frame,nodes;

chartview =  ObjectByName("AN1") ;
_ObjectCallMethod( chartview , "BeginUpdate");
_ObjectSetProperty( chartview , "IndentSiblingY", 32);
_ObjectCallMethod( _ObjectGetProperty( chartview , "VisualAppearance") , "Add", 1,"gBFLBCJwBAEHhEJAADhABWMMACAADACAxRDAMgBQKAAzQFAYawdBgABoGUZ4JhUAIIRZGMIjFDcEwxC6NIpAWCYQDENAxAJCI4DBCAZBwGKPRiASQZUhmHIDTbIEBxf" +
	"IMIRLE6PZgjOYZchqRYZSjAdIzUAFFr1J4AKbfKJpfoKBJERrScgxeBUNAZBKlY7paoKSpSGw1CTLNoRAKoYTTBK2bbmWwoap2So1XhAdS0XJcWxfGKRbxmWaZZh+R5m" +
	"XpCMjVMAGGQPIa8MLCSwIJBaHqUQLZNixLStAyxHCtKKhG+vJwHL6BcqnPKKRqSUKcWbcQADFZdYTdNjbch1TWvSZVQSecSke7BQjGJQ2YxWcZUXReeaBDK9ZS4WK+Hh" +
	"RjqAZpCkeoNC8P4DDiWp3nYVwdkaSgrGGVhSnSHJum6CgGAiBIUA0JgziGVJkGWRgTiGBAiG+ZgyDYQhCgQJZbG+UIAGEFgGBEBw9FILJNAMXgMgOIJYD4EoEGESBCBY" +
	"VIKGMIJTCiDpDliNQ+A+eB+CGCAiCiFgkgmT54HCdoGE0MhgkAM4LhOWJ/CQThIk4NQik4I5+DgP5IDOBJ/B2TgDnwaQ3k+cR0l4P5jBOfguDOCIimCSgwCMKJuDsIRj" +
	"mkUJ/B8JBBkIRAYmQcRglwP5lAOfhNDKCAikSRgxE8WJyEQIJkEGdhHhuD5xlSXYQicMR0lsP5FBmXhoD+ZhTBgfQrgwMwUnQP5HikfoFhwZxxlYdwbW0CJaWKag8EuI" +
	"5oTufwwkeIoskIMYPDOfB0iOaZznwbw2GoKoQGaKQFjqEBQikBBjGCf4nCgShoLyTCZnIP5GlqOo5YgAxejyL4GAqeBWi+BI6ngQYvisY5+jMMBHHKHJAjIRoDFqPI0g" +
	"YOxSlIFptCERpSBGbQgn6SItmyUwAHaM4MgqXBljSLl7GANRuiuMBajsBQLEgRY0gOSxKmUP5uDuCpODIaxxgqbI/g+cR8lSQBwDEYpsBObpBBabAPG6S5yniM4HHKIJ" +
	"BDiT4TnyKQ6nEbBjBeRhPnKGwYCkMYCgcGAnnGDBSD+RIHhKKJDDmMRSkSbg/nKY58jAOxzCyUIuk0CpMlCKfXAyUwsdIEwMHxZ5TiieoSA6fQjEoLh0hKWxJC0NISks" +
	"SQsDSHQaFeUQIAKRJIDuT5DnyQ4tnWfR7GCLZMBqXI+i2S5KlyOvukOfxZDICAylSSg8jWUwyGmXYPnMNhpl6/sLg0gxjNBmNkRIQR3CRHMOQIYlwjBxHQH4T45hSBBG" +
	"O/sVgQRkv7EyO4P4mgeC5E+MsTIvBfgWD+PFBIFgvgaTaPwP4mxdA/CmNQOoWgci5FGJsLAqRYiKE0PgV4TQOh0EIHkQ4xw6DnBMLsb4Hx/AHEAHEdYpwIj2D+JwDwOR" +
	"fjjE+B0H4dA1ASKcK8UYnxzhXAyOsPQvhfgYDoPEQ4RwMBziqDYXY6g9AmFyCwMomwThxHkH0fA5x/jbHuJ8f4dxxj4D8Ecf41A+j8HMMoUgTBMjGG+Pgf4nx1j/EAFA" +
	"AwAggAIAYFQQ4WgEggDIAQgI=");
nodes = _ObjectGetProperty( chartview , "Nodes");
	_ObjectCallMethod( nodes , "Add", "Child <b>1</b>","","1234");
	_ObjectCallMethod( nodes , "Add", "Sub 1","1234","AK1");
	_ObjectCallMethod( nodes , "Add", "Sub 2","1234","AK2");
	_ObjectCallMethod( nodes , "Add", "Sub 3","1234");
	_ObjectCallMethod( _ObjectCallMethod( nodes , "Add", "Child <b>2.1</b>") , "AddGroup", "Child <b>2.2</b>");
frame = _ObjectCallMethod( _ObjectGetProperty( chartview , "Frames") , "Add", "AK1,AK2");
	_ObjectCallMethod(chartview, "TemplatePut", "Dim fraObj")
	_ObjectCallMethod(chartview, "TemplatePut", frame)
	_ObjectCallMethod(chartview, "ExecuteTemplate", "fraObj.Padding(-1) = 8");
	_ObjectCallMethod(chartview, "ExecuteTemplate", "fraObj.Padding(3) = 22");
	_ObjectSetProperty( frame , "BackColor", 16777216);
	_ObjectSetProperty( _ObjectGetProperty( frame , "Pattern") , "Type", 0);
	_ObjectSetProperty( frame , "BackgroundExt", "top[4],left[4],right[4],client,bottom[4],bottom[16,back=0x01000000,text=`<sha ;;0>attention`,align=0x11]");
_ObjectCallMethod( chartview , "EndUpdate");
|
|
211
|
How can I draw the pattern with no frame
OBJECT chartview,frame,nodes,pattern;

chartview =  ObjectByName("AN1") ;
_ObjectCallMethod( chartview , "BeginUpdate");
_ObjectSetProperty( chartview , "IndentSiblingY", 32);
nodes = _ObjectGetProperty( chartview , "Nodes");
	_ObjectCallMethod( nodes , "Add", "Child <b>1</b>","","1234");
	_ObjectCallMethod( nodes , "Add", "Sub 1","1234","AK1");
	_ObjectCallMethod( nodes , "Add", "Sub 2","1234","AK2");
	_ObjectCallMethod( nodes , "Add", "Sub 3","1234");
	_ObjectCallMethod( _ObjectCallMethod( nodes , "Add", "Child <b>2.1</b>") , "AddGroup", "Child <b>2.2</b>");
frame = _ObjectCallMethod( _ObjectGetProperty( chartview , "Frames") , "Add", "AK1,AK2");
	_ObjectCallMethod(chartview, "TemplatePut", "Dim fraObj")
	_ObjectCallMethod(chartview, "TemplatePut", frame)
	_ObjectCallMethod(chartview, "ExecuteTemplate", "fraObj.Padding(-1) = 8");
	pattern = _ObjectGetProperty( frame , "Pattern");
		_ObjectSetProperty( pattern , "Type", 10);
		_ObjectSetProperty( pattern , "Color", 12500670);
_ObjectCallMethod( chartview , "EndUpdate");
|
|
210
|
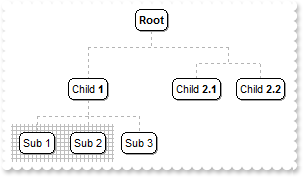
How can I show the frame with an EBN color
OBJECT chartview,frame,nodes;

chartview =  ObjectByName("AN1") ;
_ObjectCallMethod( chartview , "BeginUpdate");
_ObjectSetProperty( chartview , "IndentSiblingY", 32);
_ObjectCallMethod( _ObjectGetProperty( chartview , "VisualAppearance") , "Add", 1,"gBFLBCJwBAEHhEJAADhABWMMACAADACAxRDAMgBQKAAzQFAYawdBgABoGUZ4JhUAIIRZGMIjFDcEwxC6NIpAWCYQDENAxAJCI4DBCAZBwGKPRiASQZUhmHIDTbIEBxf" +
	"IMIRLE6PZgjOYZchqRYZSjAdIzUAFFr1J4AKbfKJpfoKBJERrScgxeBUNAZBKlY7paoKSpSGw1CTLNoRAKoYTTBK2bbmWwoap2So1XhAdS0XJcWxfGKRbxmWaZZh+R5m" +
	"XpCMjVMAGGQPIa8MLCSwIJBaHqUQLZNixLStAyxHCtKKhG+vJwHL6BcqnPKKRqSUKcWbcQADFZdYTdNjbch1TWvSZVQSecSke7BQjGJQ2YxWcZUXReeaBDK9ZS4WK+Hh" +
	"RjqAZpCkeoNC8P4DDiWp3nYVwdkaSgrGGVhSnSHJum6CgGAiBIUA0JgziGVJkGWRgTiGBAiG+ZgyDYQhCgQJZbG+UIAGEFgGBEBw9FILJNAMXgMgOIJYD4EoEGESBCBY" +
	"VIKGMIJTCiDpDliNQ+A+eB+CGCAiCiFgkgmT54HCdoGE0MhgkAM4LhOWJ/CQThIk4NQik4I5+DgP5IDOBJ/B2TgDnwaQ3k+cR0l4P5jBOfguDOCIimCSgwCMKJuDsIRj" +
	"mkUJ/B8JBBkIRAYmQcRglwP5lAOfhNDKCAikSRgxE8WJyEQIJkEGdhHhuD5xlSXYQicMR0lsP5FBmXhoD+ZhTBgfQrgwMwUnQP5HikfoFhwZxxlYdwbW0CJaWKag8EuI" +
	"5oTufwwkeIoskIMYPDOfB0iOaZznwbw2GoKoQGaKQFjqEBQikBBjGCf4nCgShoLyTCZnIP5GlqOo5YgAxejyL4GAqeBWi+BI6ngQYvisY5+jMMBHHKHJAjIRoDFqPI0g" +
	"YOxSlIFptCERpSBGbQgn6SItmyUwAHaM4MgqXBljSLl7GANRuiuMBajsBQLEgRY0gOSxKmUP5uDuCpODIaxxgqbI/g+cR8lSQBwDEYpsBObpBBabAPG6S5yniM4HHKIJ" +
	"BDiT4TnyKQ6nEbBjBeRhPnKGwYCkMYCgcGAnnGDBSD+RIHhKKJDDmMRSkSbg/nKY58jAOxzCyUIuk0CpMlCKfXAyUwsdIEwMHxZ5TiieoSA6fQjEoLh0hKWxJC0NISks" +
	"SQsDSHQaFeUQIAKRJIDuT5DnyQ4tnWfR7GCLZMBqXI+i2S5KlyOvukOfxZDICAylSSg8jWUwyGmXYPnMNhpl6/sLg0gxjNBmNkRIQR3CRHMOQIYlwjBxHQH4T45hSBBG" +
	"O/sVgQRkv7EyO4P4mgeC5E+MsTIvBfgWD+PFBIFgvgaTaPwP4mxdA/CmNQOoWgci5FGJsLAqRYiKE0PgV4TQOh0EIHkQ4xw6DnBMLsb4Hx/AHEAHEdYpwIj2D+JwDwOR" +
	"fjjE+B0H4dA1ASKcK8UYnxzhXAyOsPQvhfgYDoPEQ4RwMBziqDYXY6g9AmFyCwMomwThxHkH0fA5x/jbHuJ8f4dxxj4D8Ecf41A+j8HMMoUgTBMjGG+Pgf4nx1j/EAFA" +
	"AwAggAIAYFQQ4WgEggDIAQgI=");
nodes = _ObjectGetProperty( chartview , "Nodes");
	_ObjectCallMethod( nodes , "Add", "Child <b>1</b>","","1234");
	_ObjectCallMethod( nodes , "Add", "Sub 1","1234","AK1");
	_ObjectCallMethod( nodes , "Add", "Sub 2","1234","AK2");
	_ObjectCallMethod( nodes , "Add", "Sub 3","1234");
	_ObjectCallMethod( _ObjectCallMethod( nodes , "Add", "Child <b>2.1</b>") , "AddGroup", "Child <b>2.2</b>");
frame = _ObjectCallMethod( _ObjectGetProperty( chartview , "Frames") , "Add", "AK1,AK2");
	_ObjectCallMethod(chartview, "TemplatePut", "Dim fraObj")
	_ObjectCallMethod(chartview, "TemplatePut", frame)
	_ObjectCallMethod(chartview, "ExecuteTemplate", "fraObj.Padding(-1) = 8");
	_ObjectSetProperty( frame , "BackColor", 16777216);
	_ObjectSetProperty( _ObjectGetProperty( frame , "Pattern") , "Type", 0);
_ObjectCallMethod( chartview , "EndUpdate");
|
|
209
|
How can I show the frame with an EBN color
OBJECT chartview,frame,nodes;

chartview =  ObjectByName("AN1") ;
_ObjectCallMethod( chartview , "BeginUpdate");
_ObjectSetProperty( chartview , "IndentSiblingY", 32);
_ObjectCallMethod( _ObjectGetProperty( chartview , "VisualAppearance") , "Add", 1,"gBFLBCJwBAEHhEJAADhABDYGg6AADACAxRDAMgBQKAAzQFAYawdBgABoGUZ4JhUAIIRZGMIjFDcEwxC6NIpAWCYQDEMw0AJCIyDFCAZBsHKPRoASQZUhmHIDTbIEBxf" +
	"IMIRLE6PRhmGL4HjWOo0TLAdI0PJMBr3J4AKbfOJpfDSQZDRrTMyReDkNBBBKlY7rKoqRpCFYtDSJNoWVBIahhNiGbbiCQYfouFZdUpRV5VLTUVxbF6YZDvKZZZjmH48" +
	"RpPUIyNS2FyxHDEIxyEALYACS5fTrCNZPVjgAY4fSqMToDDpKoSWp0QjlOS5jiyYoJZ7nWa2PDdUzXCC3LgADabThqdapcBAeqYHhORRRFSiYD4eAxYw2NaTUrSeS8JB" +
	"mnmSIYlaOY6H2dwHC0CZWHSeobEmRpbGuOpeFsbhRmgS5/loAJtl4fg5E6b4LFEAwEEISgGhMGZQmocgZMWJA2AMEAxAgTYAlGEJZAkCgdngNYZAYEYYBGdRnk8CBUmq" +
	"BZOhgZgagaYZIHYHoHmICIGCKCJhiOPgmgUIRTEYKgviKQpyC6C5jAiRgygyYxIlYNoNmOAp2DoM5jwEb8miIUhCCGJBCBIRoRmSCQmEqEpkkkNhOhOZQJBCBgjmUSB0" +
	"zCSBnjYWoWmWSR2F6F5mAmBhihiZZpFyBoHGQc54n4PxPCOSJxDwZppkIb4cGcSZOHaHInwWeYdmeKZ2HyH5nCmNJxhqD5ZB4aIRg+E5kngOpOiOJoMiOKJaD6EokGkS" +
	"hChaJJpHoVoYiaaYqHaGQ6GiE5i1aJRyBSdA9A8M4QmQOJqiqMorisawKj7ggrEqRo1iyaxqmaOIumsc4OicPJqFkWhXDwIhjHiXQ3GwawikeMhsksLpOjKLQLDaUYzm" +
	"0KxWlSNZtDMdpEDubAahIVw7A6Q4slYNYNFMXJXDWLhriKZ46G6S4um6OovAuNpxjubwrladI9m4O4SmAOptlgbhSDoMADECUAzmKIxDAWQZNBwGwJkIMIsDcDJDnCPB" +
	"HA6RIxAwTwCkCcADiIUoHGUI4WioMhMhMIJKTeHIPCWSWUCcKJKnIfI3CqS4ykyPwykwcxMgMIZHg4TBuByFIOCOBJhDCDAjASRHB34RZRDQbQnEiUp0H0NxKlONJND8" +
	"UpUHUQwPEAMBzlOBw6gaSB9HSXpXkuQpsjoL4LlKcxklmNhdh8apaHaTYjG6Wp2n2NxwlydwtlYLpYjWcx7F0EMYYuxsi4DaJsMoqQ1MuHKLkNowh4D8BuBEYo8QuBvA" +
	"mMceInBDgdGQPITgnwWBbDgEUUw/g2jvD2O4XSdATDBC4wsUoiQwBYagEcJ41B6idC+F0arQQ3hjGuPYLorw0jbEsB0DIWxoAbA4OwHIvRuDmFiFAKYlBihZCoFQfA3g" +
	"jiPc+J43g5V+BvFGOcfQXhXipHWJUHwGQmjgHuNocIEAiNHFCKgKAlACgBCQFESgfwfjTHoH0L4bxsj3H6H8R43R8h+A+J8do+h/gFA+MgKAfATChAcPcaA6xvgRAGEw" +
	"NIDQQg0BMEQZAngJiiDsAUIAyALgDDAIQB4ggoA6AUEEDAKwCDgFoBkQYEA2BOGAHEGYAQDCUAEIAF4fgBANACCgEgxBICYAkOILQFQhDICuAsMIhAXiGCgLoDQQwMBr" +
	"AYOEWgORDgQHYEsIQcQSgJDCBIDggAmAkDQAgYIFgRDEEQJACQEQTAlGIKgTIExxB0CiIkWITgUBFCQKUCoYhiBXEWEIIQIwEC4ESBAKA3AhgZHGEAIYCAogIn+FARIj" +
	"QIiqBoMYXA3QNhjEIGwRwURfA5GOckDo4xaB5AiDESgQgGgYp6BAagAgwBjB4D8Q40B9AhCIBgQYkQJAqlQLkDoIwyCEEYJIKQPgkjJAyCkEo5BaCZAgHICgPhkA5AAI" +
	"YMAEBngZGGDgHgBw4DsA+IMdAfBKgSFUFQZQuQugrDKIQVglgpC+CyMsDIaQWjlFoLkB4khKA7CUCFSAxwmChEoGEZAOADgAHgB0QYtBjiZBmCIMoTBs2uHMFwaImRph" +
	"KDQE0HIrQahmGAHYTAgRhBfCYAkQgMxBhQlGCEYwYhnBAHCDkU4RByidCmJ4OozhMjZB2OcOg8ROizGcSgLIwgNBmHYAARATw/BBEMDAYQGAhhcHEKAEIphAjQC0AUII" +
	"6ASgIFANQE04hdAdCEKgQoDROBTHwDAZKDQMBnHEDwBYoQ2AtnEMYDA6B6ggFGPQQ1YgdBNCQKkIoJRSg0E8JUKQ2gshLGGB0DYCw6BYCIEIGIEhg4JCoAoQIeAXCFG0" +
	"HkJ4qR2g/FQFUAwosfiNCgOoHoRRUgVBcKUKg0BdhOCEKMAoexxAmAiMAGIogaCCDhccQIXAVCFCgLEK4ah+heFYBURwsQrBaGGFkdYJQ0CsGqKYWwVhdDLCuAIVoWQE" +
	"iDCcKsYwBBA1zEmAkA4wB6AeEIGARQEQ1j1EAK8ewBhhBYB2A0MArEzixBsB4YoWBtgZDGMIFoewDi1L0EAEggBNhHEgIkWYQwkiBCEAUZANQ2D9FCBoWwghojaBWEkN" +
	"I7QaipFoLYVw1AtDLCqGsIwrAQCzEGEIZoCBNgwCoJ0EArRbCwAUN4LY2w+hvHcAUYIuArgOHEEAFYaw3BKEgOsG4oAACAEAQEA==");
nodes = _ObjectGetProperty( chartview , "Nodes");
	_ObjectCallMethod( nodes , "Add", "Child <b>1</b>","","1234");
	_ObjectCallMethod( nodes , "Add", "Sub 1","1234","AK1");
	_ObjectCallMethod( nodes , "Add", "Sub 2","1234","AK2");
	_ObjectCallMethod( nodes , "Add", "Sub 3","1234");
	_ObjectCallMethod( _ObjectCallMethod( nodes , "Add", "Child <b>2.1</b>") , "AddGroup", "Child <b>2.2</b>");
frame = _ObjectCallMethod( _ObjectGetProperty( chartview , "Frames") , "Add", "AK1,AK2");
	_ObjectCallMethod(chartview, "TemplatePut", "Dim fraObj")
	_ObjectCallMethod(chartview, "TemplatePut", frame)
	_ObjectCallMethod(chartview, "ExecuteTemplate", "fraObj.Padding(-1) = 8");
	_ObjectSetProperty( frame , "BackColor", 16777216);
	_ObjectSetProperty( _ObjectGetProperty( frame , "Pattern") , "Type", 0);
_ObjectCallMethod( chartview , "EndUpdate");
|
|
208
|
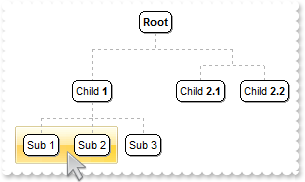
How can I show the frame with a solid color
OBJECT chartview,frame,nodes;

chartview =  ObjectByName("AN1") ;
_ObjectCallMethod( chartview , "BeginUpdate");
nodes = _ObjectGetProperty( chartview , "Nodes");
	_ObjectCallMethod( nodes , "Add", "Child <b>1</b>","","1234");
	_ObjectCallMethod( nodes , "Add", "Sub 1","1234","AK1");
	_ObjectCallMethod( nodes , "Add", "Sub 2","1234","AK2");
	_ObjectCallMethod( nodes , "Add", "Sub 3","1234");
	_ObjectCallMethod( _ObjectCallMethod( nodes , "Add", "Child <b>2.1</b>") , "AddGroup", "Child <b>2.2</b>");
frame = _ObjectCallMethod( _ObjectGetProperty( chartview , "Frames") , "Add", "AK1,AK2");
	_ObjectSetProperty( frame , "BackColor", 255);
	_ObjectSetProperty( _ObjectGetProperty( frame , "Pattern") , "Type", 0);
_ObjectCallMethod( chartview , "EndUpdate");
|
|
207
|
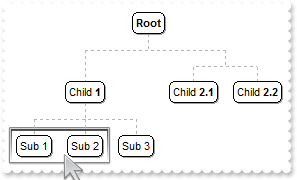
Is it possible to enlarge/shrink the frame
OBJECT chartview,frame,nodes,pattern;

chartview =  ObjectByName("AN1") ;
_ObjectCallMethod( chartview , "BeginUpdate");
nodes = _ObjectGetProperty( chartview , "Nodes");
	_ObjectCallMethod( nodes , "Add", "Child <b>1</b>","","1234");
	_ObjectCallMethod( nodes , "Add", "Sub 1","1234","AK1");
	_ObjectCallMethod( nodes , "Add", "Sub 2","1234","AK2");
	_ObjectCallMethod( nodes , "Add", "Sub 3","1234");
	_ObjectCallMethod( _ObjectCallMethod( nodes , "Add", "Child <b>2.1</b>") , "AddGroup", "Child <b>2.2</b>");
frame = _ObjectCallMethod( _ObjectGetProperty( chartview , "Frames") , "Add", "AK1,AK2");
	_ObjectSetProperty( frame , "ShowOnBackground", 0);
	_ObjectCallMethod(chartview, "TemplatePut", "Dim fraObj")
	_ObjectCallMethod(chartview, "TemplatePut", frame)
	_ObjectCallMethod(chartview, "ExecuteTemplate", "fraObj.Padding(-1) = -4");
	pattern = _ObjectGetProperty( frame , "Pattern");
		_ObjectSetProperty( pattern , "Type", 261);
		_ObjectSetProperty( pattern , "Color", 12500670);
		_ObjectSetProperty( pattern , "FrameColor", 8421504);
_ObjectCallMethod( chartview , "EndUpdate");
|
|
206
|
Is it possible to draw the frame in front, rather than showing it on the control's background
OBJECT chartview,frame,nodes,pattern;

chartview =  ObjectByName("AN1") ;
_ObjectCallMethod( chartview , "BeginUpdate");
nodes = _ObjectGetProperty( chartview , "Nodes");
	_ObjectCallMethod( nodes , "Add", "Child <b>1</b>","","1234");
	_ObjectCallMethod( nodes , "Add", "Sub 1","1234","AK1");
	_ObjectCallMethod( nodes , "Add", "Sub 2","1234","AK2");
	_ObjectCallMethod( nodes , "Add", "Sub 3","1234");
	_ObjectCallMethod( _ObjectCallMethod( nodes , "Add", "Child <b>2.1</b>") , "AddGroup", "Child <b>2.2</b>");
frame = _ObjectCallMethod( _ObjectGetProperty( chartview , "Frames") , "Add", "AK1,AK2");
	_ObjectSetProperty( frame , "ShowOnBackground", 0);
	pattern = _ObjectGetProperty( frame , "Pattern");
		_ObjectSetProperty( pattern , "Type", 261);
		_ObjectSetProperty( pattern , "Color", 12500670);
		_ObjectSetProperty( pattern , "FrameColor", 8421504);
_ObjectCallMethod( chartview , "EndUpdate");
|
|
205
|
How do I show or hide a frame
OBJECT chartview,frame,nodes,pattern;

chartview =  ObjectByName("AN1") ;
_ObjectCallMethod( chartview , "BeginUpdate");
nodes = _ObjectGetProperty( chartview , "Nodes");
	_ObjectCallMethod( nodes , "Add", "Child <b>1</b>","","1234");
	_ObjectCallMethod( nodes , "Add", "Sub 1","1234","AK1");
	_ObjectCallMethod( nodes , "Add", "Sub 2","1234","AK2");
	_ObjectCallMethod( nodes , "Add", "Sub 3","1234");
	_ObjectCallMethod( _ObjectCallMethod( nodes , "Add", "Child <b>2.1</b>") , "AddGroup", "Child <b>2.2</b>");
frame = _ObjectCallMethod( _ObjectGetProperty( chartview , "Frames") , "Add", "AK1,AK2");
	_ObjectSetProperty( frame , "Visible", -1);
	pattern = _ObjectGetProperty( frame , "Pattern");
		_ObjectSetProperty( pattern , "Type", 261);
		_ObjectSetProperty( pattern , "Color", 12500670);
		_ObjectSetProperty( pattern , "FrameColor", 8421504);
_ObjectCallMethod( chartview , "EndUpdate");
|
|
204
|
How can I display the frame arround the node itself
OBJECT chartview,frame,node,nodes,pattern;

chartview =  ObjectByName("AN1") ;
_ObjectCallMethod( chartview , "BeginUpdate");
node = _ObjectGetProperty( chartview , "Root");
	_ObjectCallMethod( node , "AddAssistant", "Assistant 1");
	_ObjectCallMethod( node , "AddAssistant", "Assistant 2");
nodes = _ObjectGetProperty( chartview , "Nodes");
	_ObjectCallMethod( nodes , "Add", "Child <b>1</b>","","1234");
	_ObjectCallMethod( nodes , "Add", "Sub 1","1234","AK1");
	_ObjectCallMethod( nodes , "Add", "Sub 2","1234","AK2");
	_ObjectCallMethod( nodes , "Add", "Sub 3","1234");
	_ObjectSetProperty( _ObjectCallMethod( _ObjectCallMethod( nodes , "Add", "Child <b>2.1</b>","","GR1") , "AddGroup", "Child <b>2.2</b>") , "Key", "GR2");
frame = _ObjectCallMethod( _ObjectGetProperty( chartview , "Frames") , "Add", "1234");
	pattern = _ObjectGetProperty( frame , "Pattern");
		_ObjectSetProperty( pattern , "Type", 261);
		_ObjectSetProperty( pattern , "Color", 12500670);
		_ObjectSetProperty( pattern , "FrameColor", 8421504);
frame = _ObjectCallMethod( _ObjectGetProperty( chartview , "Frames") , "Add", "GR2");
	pattern = _ObjectGetProperty( frame , "Pattern");
		_ObjectSetProperty( pattern , "Type", 261);
		_ObjectSetProperty( pattern , "Color", 12500670);
		_ObjectSetProperty( pattern , "FrameColor", 8421504);
_ObjectCallMethod( chartview , "EndUpdate");
|
|
203
|
How can I display the frame arround group nodes only
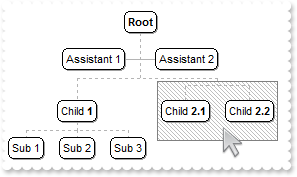
OBJECT chartview,frame,node,nodes,pattern;

chartview =  ObjectByName("AN1") ;
_ObjectCallMethod( chartview , "BeginUpdate");
node = _ObjectGetProperty( chartview , "Root");
	_ObjectCallMethod( node , "AddAssistant", "Assistant 1");
	_ObjectCallMethod( node , "AddAssistant", "Assistant 2");
nodes = _ObjectGetProperty( chartview , "Nodes");
	_ObjectCallMethod( nodes , "Add", "Child <b>1</b>","","1234");
	_ObjectCallMethod( nodes , "Add", "Sub 1","1234","AK1");
	_ObjectCallMethod( nodes , "Add", "Sub 2","1234","AK2");
	_ObjectCallMethod( nodes , "Add", "Sub 3","1234");
	_ObjectSetProperty( _ObjectCallMethod( _ObjectCallMethod( nodes , "Add", "Child <b>2.1</b>","","GR1") , "AddGroup", "Child <b>2.2</b>") , "Key", "GR2");
frame = _ObjectCallMethod( _ObjectGetProperty( chartview , "Frames") , "Add", "root");
	_ObjectSetProperty( frame , "Nodes", "GR1(group)");
	pattern = _ObjectGetProperty( frame , "Pattern");
		_ObjectSetProperty( pattern , "Type", 261);
		_ObjectSetProperty( pattern , "Color", 12500670);
		_ObjectSetProperty( pattern , "FrameColor", 8421504);
_ObjectCallMethod( chartview , "EndUpdate");
|
|
202
|
How can I display the frame arround assistant nodes only
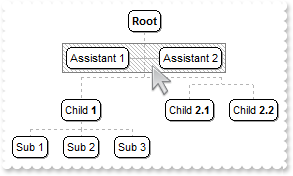
OBJECT chartview,frame,node,nodes,pattern;

chartview =  ObjectByName("AN1") ;
_ObjectCallMethod( chartview , "BeginUpdate");
node = _ObjectGetProperty( chartview , "Root");
	_ObjectCallMethod( node , "AddAssistant", "Assistant 1");
	_ObjectCallMethod( node , "AddAssistant", "Assistant 2");
nodes = _ObjectGetProperty( chartview , "Nodes");
	_ObjectCallMethod( nodes , "Add", "Child <b>1</b>","","1234");
	_ObjectCallMethod( nodes , "Add", "Sub 1","1234","AK1");
	_ObjectCallMethod( nodes , "Add", "Sub 2","1234","AK2");
	_ObjectCallMethod( nodes , "Add", "Sub 3","1234");
	_ObjectCallMethod( _ObjectCallMethod( nodes , "Add", "Child <b>2.1</b>") , "AddGroup", "Child <b>2.2</b>");
frame = _ObjectCallMethod( _ObjectGetProperty( chartview , "Frames") , "Add", "root");
	_ObjectSetProperty( frame , "Nodes", "root(assistant)");
	pattern = _ObjectGetProperty( frame , "Pattern");
		_ObjectSetProperty( pattern , "Type", 261);
		_ObjectSetProperty( pattern , "Color", 12500670);
		_ObjectSetProperty( pattern , "FrameColor", 8421504);
_ObjectCallMethod( chartview , "EndUpdate");
|
|
201
|
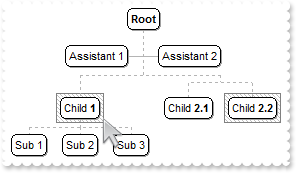
How can I display the frame arround child nodes only
OBJECT chartview,frame,node,nodes,pattern;

chartview =  ObjectByName("AN1") ;
_ObjectCallMethod( chartview , "BeginUpdate");
node = _ObjectGetProperty( chartview , "Root");
	_ObjectCallMethod( node , "AddAssistant", "Assistant 1");
	_ObjectCallMethod( node , "AddAssistant", "Assistant 2");
nodes = _ObjectGetProperty( chartview , "Nodes");
	_ObjectCallMethod( nodes , "Add", "Child <b>1</b>","","1234");
	_ObjectCallMethod( nodes , "Add", "Sub 1","1234","AK1");
	_ObjectCallMethod( nodes , "Add", "Sub 2","1234","AK2");
	_ObjectCallMethod( nodes , "Add", "Sub 3","1234");
	_ObjectCallMethod( _ObjectCallMethod( nodes , "Add", "Child <b>2.1</b>") , "AddGroup", "Child <b>2.2</b>");
frame = _ObjectCallMethod( _ObjectGetProperty( chartview , "Frames") , "Add", "root");
	_ObjectSetProperty( frame , "Nodes", "root(child)");
	pattern = _ObjectGetProperty( frame , "Pattern");
		_ObjectSetProperty( pattern , "Type", 261);
		_ObjectSetProperty( pattern , "Color", 12500670);
		_ObjectSetProperty( pattern , "FrameColor", 8421504);
_ObjectCallMethod( chartview , "EndUpdate");
|
|
200
|
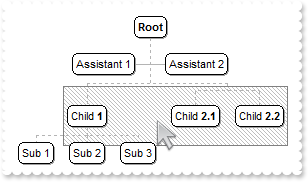
How can I show the frame arround all child, assistant, group nodes
OBJECT chartview,frame,node,nodes,pattern;

chartview =  ObjectByName("AN1") ;
_ObjectCallMethod( chartview , "BeginUpdate");
node = _ObjectGetProperty( chartview , "Root");
	_ObjectCallMethod( node , "AddAssistant", "Assistant 1");
	_ObjectCallMethod( node , "AddAssistant", "Assistant 2");
nodes = _ObjectGetProperty( chartview , "Nodes");
	_ObjectCallMethod( nodes , "Add", "Child <b>1</b>","","1234");
	_ObjectCallMethod( nodes , "Add", "Sub 1","1234","AK1");
	_ObjectCallMethod( nodes , "Add", "Sub 2","1234","AK2");
	_ObjectCallMethod( nodes , "Add", "Sub 3","1234");
	_ObjectCallMethod( _ObjectCallMethod( nodes , "Add", "Child <b>2.1</b>") , "AddGroup", "Child <b>2.2</b>");
frame = _ObjectCallMethod( _ObjectGetProperty( chartview , "Frames") , "Add", "root");
	_ObjectSetProperty( frame , "Nodes", "root(all)");
	pattern = _ObjectGetProperty( frame , "Pattern");
		_ObjectSetProperty( pattern , "Type", 261);
		_ObjectSetProperty( pattern , "Color", 12500670);
		_ObjectSetProperty( pattern , "FrameColor", 8421504);
_ObjectCallMethod( chartview , "EndUpdate");
|
|
199
|
We need to visualy group nodes that have the same parent but also have other siblings. Is it anyway possible to draw an additional border around a group of nodes in this control
OBJECT chartview,node,nodes,pattern;

chartview =  ObjectByName("AN1") ;
_ObjectCallMethod( chartview , "BeginUpdate");
node = _ObjectGetProperty( chartview , "Root");
	_ObjectCallMethod( node , "AddAssistant", "Assistant 1");
	_ObjectCallMethod( node , "AddAssistant", "Assistant 2");
nodes = _ObjectGetProperty( chartview , "Nodes");
	_ObjectCallMethod( nodes , "Add", "Child <b>1</b>","","1234");
	_ObjectCallMethod( nodes , "Add", "Sub 1","1234","AK1");
	_ObjectCallMethod( nodes , "Add", "Sub 2","1234","AK2");
	_ObjectCallMethod( nodes , "Add", "Sub 3","1234");
	_ObjectCallMethod( _ObjectCallMethod( nodes , "Add", "Child <b>2.1</b>") , "AddGroup", "Child <b>2.2</b>");
pattern = _ObjectGetProperty( _ObjectCallMethod( _ObjectGetProperty( chartview , "Frames") , "Add", "AK1,AK2") , "Pattern");
	_ObjectSetProperty( pattern , "Type", 261);
	_ObjectSetProperty( pattern , "Color", 12500670);
	_ObjectSetProperty( pattern , "FrameColor", 8421504);
_ObjectCallMethod( chartview , "EndUpdate");
|
|
198
|
How can I draw a pattern on a node
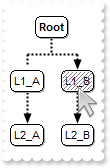
OBJECT chartview,frame,nodes,pattern;

chartview =  ObjectByName("AN1") ;
_ObjectSetProperty( chartview , "IndentSiblingY", 30);
_ObjectSetProperty( chartview , "ShowLinksDir", -1);
_ObjectSetProperty( chartview , "PenWidthLink", 2);
_ObjectSetProperty( chartview , "LinkColor", 0);
_ObjectSetProperty( chartview , "AntiAliasing", -1);
nodes = _ObjectGetProperty( chartview , "Nodes");
	_ObjectSetProperty( _ObjectCallMethod( nodes , "Add", "L1_A","","LA") , "ShowLinkDir", 0);
	_ObjectCallMethod( nodes , "Add", "L1_B","","LB");
	_ObjectCallMethod( nodes , "Add", "L2_A","LA","LA2");
	_ObjectCallMethod( nodes , "Add", "L2_B","LB","LB2");
frame = _ObjectCallMethod( _ObjectGetProperty( chartview , "Frames") , "Add", "LB");
	_ObjectCallMethod(chartview, "TemplatePut", "Dim fraObj")
	_ObjectCallMethod(chartview, "TemplatePut", frame)
	_ObjectCallMethod(chartview, "ExecuteTemplate", "fraObj.Padding(-1) = -2");
	pattern = _ObjectGetProperty( frame , "Pattern");
		_ObjectSetProperty( pattern , "Type", 6);
		_ObjectSetProperty( pattern , "Color", 8421504);
	_ObjectSetProperty( frame , "ShowOnBackground", 0);
|
|
197
|
How do I use as a WBS control (WBS is a hierarchical and incremental decomposition of the project into phases, deliverables and work packages )
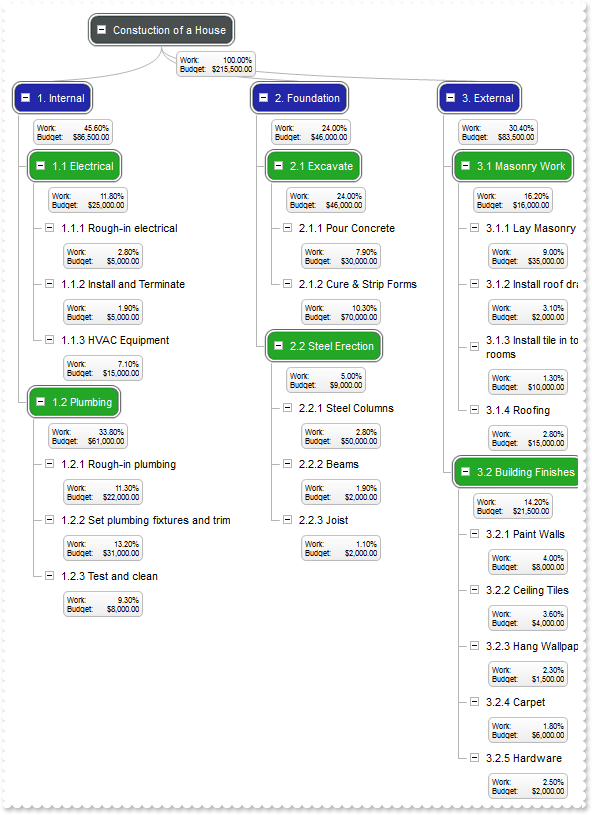
OBJECT appearance,chartview,node,nodes;

chartview =  ObjectByName("AN1") ;
_ObjectCallMethod( chartview , "BeginUpdate");
appearance = _ObjectGetProperty( chartview , "VisualAppearance");
	_ObjectCallMethod( appearance , "Add", 1,"gBFLBCJwBAEHhEJAADhABdQFg6AADACAxRDAMgBQKAAzQFAYawdBgABoGUZ4JhUAIIRZGMIjFDcEwxC6NIpAWCYQDENQwSSMMJwSKYYBiASEYJASQZUhmHIDTbIEBxf" +
	"IMIRLE6PZbmEYYfgeNY6TQCcIgVD0ExhAZ2Q4EQAKRpOFY/DBQNLgAKNCQ3LaQY7BaKgZouTYDVrVNSVFC0IBkGoSbauCIJHrGCZ1RBYMI0VDNRwHJiMbRtSyqXjGJ4p" +
	"SrAcq0FAgYRHI6jZxnGL5chqPqGVjMNZ1bQuKwzT0Ld5wTYsdydBK1MIkTKKaoORZgRpYUI6FAeSgBWyPcCqPSoDrKdo4XLdYwbeAFcSPD6+NBhG7tXm/NarNTgTB6DB" +
	"thsGJbgYYw9AQVxBoOch2hEbh+nAARYkQdZ7CMPYGH+FxmlqbJ5lqDAdjMC5AmIW54hwaBvA4IQ8D+T8IFscgenAAZMHiEgWiWdRZlSAAhAkFAGq6dAdEcIYVF4QJKCA" +
	"HQDBCBJYGUGQNhCEIhiSCJaGAYQWBsIYmEEFgJAGQ42CyC4iliPgygsT4olSXg3g2Qwwk0MpMiMLJIg8Y54niTYOmPPJMDMDIonSSU7jMJJbDaTYjlYUoMmMCRWFQAAl" +
	"EkZgtDgTgjgCJQpEoIgkgkIQHnIAB7CACARnIaIaiaGYuG6GxmhmFB7CGSICAyHwoAmQxQlQNIlikWgthYIwaAYVQvAuQpsg0IxIhKTIzCwToTiiaYACkChGhKJJpEOQ" +
	"oWC+C5imyCgiggYpUzMZ5Yj6AIfg6UpcjgLYInIPILhOTYaEIUg9EoItfCGCByAiCV2lIKILCGK4qnKO4YggWpQgIJxJmIaJhDgDgKECaIykkUhUhILQLEKRh9iiYpzC" +
	"SSQxmgcgkm2NppAKbI8C4RoBiQYgSgSMQQEEEIDjECBDA8LorjKa47EQMQSm4DpEhEKBDBeRgBGqMQnmkA5in4JAJAINoEC6JR4jyaQ6E6AhEhIIxNBMRJPiQCYyHCGA" +
	"UgUMQwEgEhhkEOBHBOBJxCMHJHjGXB/CKSBxlENwaj1qgsEwERICIDB/iQDgjgiYYvE2cx8l2KIinoEI5CYSYiFqEAz0mMBZBbwIkEsEN+gMSpSHSTITEqSoEFyGBHCo" +
	"SoihqEAsgsIo8ikKhKGiVJ6AADwTkicQlAkUhElA+Z4VUHpHGuRA8lMdI9DscJc8r5QQAaIYsGUOpOjoOwHCEJAUgBh8B1EAAcHIzg5gPCGNgdQfRPhnGiLINhhQEDCB" +
	"cGUDYphxjLHkNgfwTARhiHEBYWAVxpI1HQDcDjthiAADoKcCgJgbs7FyG4LQagBBgE0CMOYOxLhtGY/AcAegNgTHIPkHISAHADEQNYOA2BwAHEQHABwQxMDbCQEscoEB" +
	"AAgEOD0V4cR0jyGCPAPwHAvh0EAOIHIDRfA/EaGMfYfguAACiBQIg/xWAbH0F8J4bxSD6G8MUMo7Q9ieHuI8eA0gLjfG2PUPQnwvhvHsPsGABxhD8E+AMbgfhVDJH2L8" +
	"U48wAjbEGPwPo7x8j4F4FccwHAhhiEgBQEQhAnCDGgHwBonxiAZD+G8Lo/hHj3H8PELIiBwgOFCNQHAqQAhYBWAUIARAECgHyKkIIqAIgGGCLgUIFAhB5CQAcFAGgcEH" +
	"HKBwUYkAdiHDgOaAIKBigYCCFAFQhBzChAWKEOYzwDhCEwFMBQNxwD3C8CsPgHQhANEuA4Uw+gdhHDAOwBogRYAzFuGAQIEgQAzCSGUAIbAXAFCiKIGghhBCQAeAFIgD" +
	"gwjMByEAAYXg1hiEwFgBYAQugAGIPsTodgnDSBgMca4LhqChCgD4CIYgYBDmcI4GIxgUCYAm1oPIjwgjmFQMYWA1gNCiBUqcII6gegUEAHwB4oRwhzEGLge4GAOC6HUA" +
	"cMIsAbCGDqLYHYVBACTAkIIIAYigCIGcBQCArQKiiFQFERQUQhDMAOBgcIWAggUBGIMfAVAHhCBwEgBAMg+jbFqCcHYLxvg4D2A8QI3AziMHiJoUgFhACyCwIINofwHi" +
	"JDAJUKw2B2ARGEEAIwCxIh2BaNQQA/ROBRGoFYQ48B/AeEGEt99lQOgDFgGcAtFgdgHEANIMAhAIDKAygkQAEAAjxBeIoCI7QfjUEEEwDIIgWBFEQHUSANxsAqEEEUdw" +
	"lA4iJCSFYEwhBsCXE0KoIAexnj4DoDkEwaBmgYCGAwMADAkCFCMMYAQOgMhQEIHsaIVQQDXFOOgRtwAUguAcAUU1iw1CWA6OwdIOQFBxCgCkDgeBribBmIgP4KQiAAB+" +
	"KoAg2QNiDDoG0BQyQzg+EGOAWAFgRC4DsEURQYAdhWFKAoKAVQAB/AcHEaAORiioFqBYMWFATCZEsBsIYcA0gMGCJwGAhg4DQAwKsDAYQGzZBkAcSA8gODEBEGQVIQha" +
	"jUEeeYKY1QIDrBCIAEg0xIAwEgBNkAAADUTA6B4MQEwv0UEGLAUgzhf04AKGEg4BhYD2B0MUAABApAAvqI8WAqAdDGGwJsEIXwWDtE0AAA4fhmDZCmJMMwbBkgBIC");
	_ObjectCallMethod( appearance , "Add", 2,"gBFLBCJwBAEHhEJAADhABEEMACAADACAxRDAMgBQKAAzQFAYawdBgABoGUZ4JhUAIIRZGMIgdBINQTDCLYyiUBYJhAMYSAJCI4jBCAZRXEAaQIkKY4ZDKCY2QLIEgSF" +
	"CETQlEAYZgkCB5UiGNIkQLSFDABJMBraDgSAApeoYVj4NZASANFB0bKcQAVDSOKRjeCacpOUpQRZLIyiLZVWQSGoYLahW4YQiKIJKRTXdhULQtLS5FaWZbte6LchqOAA" +
	"YbOV6ynSeV6NUJNc5xVicBgrBKlI6nGxIJqaZpVYzPeQQTTUby5OyEbyADJ4DqEAKaUrZNoZfhkBhlNa2YguC4gAzudaUZhCOqABpWYYLDS/JSGCYJGDcOaVRZ0FJUVw" +
	"Pg8GZkkCcBQDGJw0HOJ5gECdRUi0dxXi2IJbG4Jp+huHpzH0GouF2eA+B4F4bkESwEEISgGhMGZQmocgZFQFAki4TIAAECBNgCUYQsaCgRjQdRjAYERhmIBB5gIQBwm2" +
	"BROlOSgaDMIZCmoHoHmICIGB8MJiEOFgmD+IoIGEA4GA4aI0kSC5NliRJrgyYxIlYNoNkyGJkliDpPlidQDD2ZADBYQg6iQQ46EaEZkgkJhKhGTw5DSSITk4eRFAMNRl" +
	"EMXhWDuZYJC4WoWmWA4+CYORMGmBQDguTBDg4Zg8GaA5CGqGpmkmNhuhuZoim4chAkuaZUmmHZPBgahoh6Z5JnYfofmGI5IjmIJnEmWh3D4D0nn+IpokmboBgeaBSnod" +
	"w6E+I5YnOIBpgoZoaiaJ9IHOJAAAmVoSh2aRaF6G4pmqCBqh6KAqCkEJqD6TxzlKHosmsSpWjaExPEqZosh0apqkKMotmwCwCjkPQrjKeg0D8T4TlaQ4ymySw2k6LhPF" +
	"sRpFDsLRDmCdw9i0GxmlqNptksdJ2jebBTjaYoQC0ex+maOZuguJppjkLBZByeI7m4S5GnKPJvEkApvD4Jwim6EY7i8C5Wn6P4vHuZoRhcT4cBad5BnCDAnAqO5wFOZw" +
	"CigZxZiyepEnCXBXBaRZxgwFwTD6MJ6goaw+nETBnCKSIxjwdh1h6T5jm8IOuEyNwukuT4siie5JguaZsn+ShzAyZw6kyMJ4hCQ44g6U5/DeTI0E0FxGlGcojnMSgvDS" +
	"SROFQOANnMfxCD+dItFcVpVnWDRbFOFxMH0dQDiATItgaZpUnUOJ3GaWZ2gOdxklCDQNjYX4KmEaYYmMM43EkP0d4tR3gbBKKgOwGgtjsFQGodQuxCAvAWFIMwnwGgcE" +
	"yCYC4FRijxE4Gl0AnAuCOFWBUAABwth+AACAEBAQ=");
	_ObjectCallMethod( appearance , "Add", 3,"gBFLBCJwBAEHhEJAADhABI8IQAAYAQGKIYBkAKBQAGaAoDDWDoMAANAyjPBMKgBBCLIxhEYobgmGIXRpFMbxAKQahLEiTIklBI8ExXFqMQCkGKocgONYgTLOMZOXCEE" +
	"wCgI=");
_ObjectSetProperty( chartview , "AntiAliasing", -1);
_ObjectSetProperty( chartview , "IndentSiblingY", 4);
_ObjectSetProperty( chartview , "ShowRoundLink", -1);
_ObjectSetProperty( chartview , "PenLink", 0);
_ObjectSetProperty( chartview , "SelColor", 65535);
_ObjectSetProperty( chartview , "HasButtons", -1);
_ObjectCallMethod(chartview, "ExecuteTemplate", "DefaultNodePadding(-1) = 6");
node = _ObjectGetProperty( chartview , "Root");
	_ObjectSetProperty( node , "Caption", "Constuction of a House");
	_ObjectSetProperty( node , "BackColor", 16777216);
	_ObjectSetProperty( node , "ForeColor", 16777215);
	node = _ObjectCallMethod( node , "AddAssistant", "<font ;6>Work:<r>100.00%<br>Budget:<r>$215,500.00");
		_ObjectSetProperty( node , "Left", 0);
		_ObjectSetProperty( node , "ShowLinks", 0);
		_ObjectCallMethod(chartview, "TemplatePut", "Dim nodObj")
		_ObjectCallMethod(chartview, "TemplatePut", node)
		_ObjectCallMethod(chartview, "ExecuteTemplate", "nodObj.Padding(-1) = 0");
		_ObjectSetProperty( node , "FixedWidth", 72);
		_ObjectSetProperty( node , "BackColor", 33554432);
nodes = _ObjectGetProperty( chartview , "Nodes");
	node = _ObjectCallMethod( nodes , "Add", "1. Internal","Root","Internal");
		_ObjectSetProperty( node , "ArrangeSiblingNodesAs", 2);
		_ObjectSetProperty( node , "ShowRoundLink", 0);
		_ObjectSetProperty( node , "BackColor", 33488896);
		_ObjectSetProperty( node , "ForeColor", 16777215);
		node = _ObjectCallMethod( node , "AddAssistant", "<font ;6>Work:<r>45.60%<br>Budget:<r>$86,500.00");
			_ObjectSetProperty( node , "Left", 0);
			_ObjectSetProperty( node , "ShowLinks", 0);
			_ObjectCallMethod(chartview, "TemplatePut", "Dim nodObj")
			_ObjectCallMethod(chartview, "TemplatePut", node)
			_ObjectCallMethod(chartview, "ExecuteTemplate", "nodObj.Padding(-1) = 0");
			_ObjectSetProperty( node , "FixedWidth", 72);
			_ObjectSetProperty( node , "BackColor", 33554432);
	node = _ObjectCallMethod( nodes , "Add", "1.1 Electrical","Internal","Electrical");
		_ObjectSetProperty( node , "ShowRoundLink", 0);
		_ObjectSetProperty( node , "BackColor", 16842496);
		_ObjectSetProperty( node , "ForeColor", 16777215);
		node = _ObjectCallMethod( node , "AddAssistant", "<font ;6>Work:<r>11.80%<br>Budget:<r>$25,000.00");
			_ObjectSetProperty( node , "Left", 0);
			_ObjectSetProperty( node , "ShowLinks", 0);
			_ObjectCallMethod(chartview, "ExecuteTemplate", "nodObj.Padding(-1) = 0");
			_ObjectSetProperty( node , "FixedWidth", 72);
			_ObjectSetProperty( node , "BackColor", 33554432);
	node = _ObjectCallMethod( nodes , "Add", "1.1.1 Rough-in electrical","Electrical","RoughElectrical");
		_ObjectSetProperty( node , "BackColor", 50331648);
		_ObjectCallMethod(chartview, "TemplatePut", "Dim nodObj")
		_ObjectCallMethod(chartview, "TemplatePut", node)
		_ObjectCallMethod(chartview, "ExecuteTemplate", "nodObj.Padding(-1) = 0");
		node = _ObjectCallMethod( node , "AddAssistant", "<font ;6>Work:<r>2.80%<br>Budget:<r>$5,000.00");
			_ObjectSetProperty( node , "Left", 0);
			_ObjectSetProperty( node , "ShowLinks", 0);
			_ObjectCallMethod(chartview, "TemplatePut", "Dim nodObj")
			_ObjectCallMethod(chartview, "TemplatePut", node)
			_ObjectCallMethod(chartview, "ExecuteTemplate", "nodObj.Padding(-1) = 0");
			_ObjectSetProperty( node , "FixedWidth", 72);
			_ObjectSetProperty( node , "BackColor", 33554432);
	node = _ObjectCallMethod( nodes , "Add", "1.1.2 Install and Terminate","Electrical","InstallTerminate");
		_ObjectSetProperty( node , "BackColor", 50331648);
		_ObjectCallMethod(chartview, "TemplatePut", "Dim nodObj")
		_ObjectCallMethod(chartview, "TemplatePut", node)
		_ObjectCallMethod(chartview, "ExecuteTemplate", "nodObj.Padding(-1) = 0");
		node = _ObjectCallMethod( node , "AddAssistant", "<font ;6>Work:<r>1.90%<br>Budget:<r>$5,000.00");
			_ObjectSetProperty( node , "Left", 0);
			_ObjectSetProperty( node , "ShowLinks", 0);
			_ObjectCallMethod(chartview, "TemplatePut", "Dim nodObj")
			_ObjectCallMethod(chartview, "TemplatePut", node)
			_ObjectCallMethod(chartview, "ExecuteTemplate", "nodObj.Padding(-1) = 0");
			_ObjectSetProperty( node , "FixedWidth", 72);
			_ObjectSetProperty( node , "BackColor", 33554432);
	node = _ObjectCallMethod( nodes , "Add", "1.1.3 HVAC Equipment","Electrical","HVAC");
		_ObjectSetProperty( node , "BackColor", 50331648);
		_ObjectCallMethod(chartview, "TemplatePut", "Dim nodObj")
		_ObjectCallMethod(chartview, "TemplatePut", node)
		_ObjectCallMethod(chartview, "ExecuteTemplate", "nodObj.Padding(-1) = 0");
		node = _ObjectCallMethod( node , "AddAssistant", "<font ;6>Work:<r>7.10%<br>Budget:<r>$15,000.00");
			_ObjectSetProperty( node , "Left", 0);
			_ObjectSetProperty( node , "ShowLinks", 0);
			_ObjectCallMethod(chartview, "TemplatePut", "Dim nodObj")
			_ObjectCallMethod(chartview, "TemplatePut", node)
			_ObjectCallMethod(chartview, "ExecuteTemplate", "nodObj.Padding(-1) = 0");
			_ObjectSetProperty( node , "FixedWidth", 72);
			_ObjectSetProperty( node , "BackColor", 33554432);
	node = _ObjectCallMethod( nodes , "Add", "1.2 Plumbing","Internal","Plumbing");
		_ObjectSetProperty( node , "ShowRoundLink", 0);
		_ObjectSetProperty( node , "BackColor", 16842496);
		_ObjectSetProperty( node , "ForeColor", 16777215);
		node = _ObjectCallMethod( node , "AddAssistant", "<font ;6>Work:<r>33.80%<br>Budget:<r>$61,000.00");
			_ObjectSetProperty( node , "Left", 0);
			_ObjectSetProperty( node , "ShowLinks", 0);
			_ObjectCallMethod(chartview, "ExecuteTemplate", "nodObj.Padding(-1) = 0");
			_ObjectSetProperty( node , "FixedWidth", 72);
			_ObjectSetProperty( node , "BackColor", 33554432);
	node = _ObjectCallMethod( nodes , "Add", "1.2.1 Rough-in plumbing","Plumbing","RoughPlumbing");
		_ObjectSetProperty( node , "BackColor", 50331648);
		_ObjectCallMethod(chartview, "TemplatePut", "Dim nodObj")
		_ObjectCallMethod(chartview, "TemplatePut", node)
		_ObjectCallMethod(chartview, "ExecuteTemplate", "nodObj.Padding(-1) = 0");
		node = _ObjectCallMethod( node , "AddAssistant", "<font ;6>Work:<r>11.30%<br>Budget:<r>$22,000.00");
			_ObjectSetProperty( node , "Left", 0);
			_ObjectSetProperty( node , "ShowLinks", 0);
			_ObjectCallMethod(chartview, "TemplatePut", "Dim nodObj")
			_ObjectCallMethod(chartview, "TemplatePut", node)
			_ObjectCallMethod(chartview, "ExecuteTemplate", "nodObj.Padding(-1) = 0");
			_ObjectSetProperty( node , "FixedWidth", 72);
			_ObjectSetProperty( node , "BackColor", 33554432);
	node = _ObjectCallMethod( nodes , "Add", "1.2.2 Set plumbing fixtures and trim","Plumbing","PlumbingFixtures");
		_ObjectSetProperty( node , "Width", 256);
		_ObjectSetProperty( node , "BackColor", 50331648);
		_ObjectCallMethod(chartview, "TemplatePut", "Dim nodObj")
		_ObjectCallMethod(chartview, "TemplatePut", node)
		_ObjectCallMethod(chartview, "ExecuteTemplate", "nodObj.Padding(-1) = 0");
		node = _ObjectCallMethod( node , "AddAssistant", "<font ;6>Work:<r>13.20%<br>Budget:<r>$31,000.00");
			_ObjectSetProperty( node , "Left", 0);
			_ObjectSetProperty( node , "ShowLinks", 0);
			_ObjectCallMethod(chartview, "TemplatePut", "Dim nodObj")
			_ObjectCallMethod(chartview, "TemplatePut", node)
			_ObjectCallMethod(chartview, "ExecuteTemplate", "nodObj.Padding(-1) = 0");
			_ObjectSetProperty( node , "FixedWidth", 72);
			_ObjectSetProperty( node , "BackColor", 33554432);
	node = _ObjectCallMethod( nodes , "Add", "1.2.3 Test and clean","Plumbing","PlumbingTest");
		_ObjectSetProperty( node , "BackColor", 50331648);
		_ObjectCallMethod(chartview, "TemplatePut", "Dim nodObj")
		_ObjectCallMethod(chartview, "TemplatePut", node)
		_ObjectCallMethod(chartview, "ExecuteTemplate", "nodObj.Padding(-1) = 0");
		node = _ObjectCallMethod( node , "AddAssistant", "<font ;6>Work:<r>9.30%<br>Budget:<r>$8,000.00");
			_ObjectSetProperty( node , "Left", 0);
			_ObjectSetProperty( node , "ShowLinks", 0);
			_ObjectCallMethod(chartview, "TemplatePut", "Dim nodObj")
			_ObjectCallMethod(chartview, "TemplatePut", node)
			_ObjectCallMethod(chartview, "ExecuteTemplate", "nodObj.Padding(-1) = 0");
			_ObjectSetProperty( node , "FixedWidth", 72);
			_ObjectSetProperty( node , "BackColor", 33554432);
	node = _ObjectCallMethod( nodes , "Add", "2. Foundation","Root","Foundation");
		_ObjectSetProperty( node , "ArrangeSiblingNodesAs", 2);
		_ObjectSetProperty( node , "ShowRoundLink", 0);
		_ObjectSetProperty( node , "BackColor", 33488896);
		_ObjectSetProperty( node , "ForeColor", 16777215);
		node = _ObjectCallMethod( node , "AddAssistant", "<font ;6>Work:<r>24.00%<br>Budget:<r>$46,000.00");
			_ObjectSetProperty( node , "Left", 0);
			_ObjectSetProperty( node , "ShowLinks", 0);
			_ObjectCallMethod(chartview, "ExecuteTemplate", "nodObj.Padding(-1) = 0");
			_ObjectSetProperty( node , "FixedWidth", 72);
			_ObjectSetProperty( node , "BackColor", 33554432);
	node = _ObjectCallMethod( nodes , "Add", "2.1 Excavate","Foundation","Excavate");
		_ObjectSetProperty( node , "ShowRoundLink", 0);
		_ObjectSetProperty( node , "BackColor", 16842496);
		_ObjectSetProperty( node , "ForeColor", 16777215);
		node = _ObjectCallMethod( node , "AddAssistant", "<font ;6>Work:<r>24.00%<br>Budget:<r>$46,000.00");
			_ObjectSetProperty( node , "Left", 0);
			_ObjectSetProperty( node , "ShowLinks", 0);
			_ObjectCallMethod(chartview, "ExecuteTemplate", "nodObj.Padding(-1) = 0");
			_ObjectSetProperty( node , "FixedWidth", 72);
			_ObjectSetProperty( node , "BackColor", 33554432);
	node = _ObjectCallMethod( nodes , "Add", "2.1.1 Pour Concrete","Excavate","Concrete");
		_ObjectSetProperty( node , "BackColor", 50331648);
		_ObjectCallMethod(chartview, "TemplatePut", "Dim nodObj")
		_ObjectCallMethod(chartview, "TemplatePut", node)
		_ObjectCallMethod(chartview, "ExecuteTemplate", "nodObj.Padding(-1) = 0");
		node = _ObjectCallMethod( node , "AddAssistant", "<font ;6>Work:<r>7.90%<br>Budget:<r>$30,000.00");
			_ObjectSetProperty( node , "Left", 0);
			_ObjectSetProperty( node , "ShowLinks", 0);
			_ObjectCallMethod(chartview, "TemplatePut", "Dim nodObj")
			_ObjectCallMethod(chartview, "TemplatePut", node)
			_ObjectCallMethod(chartview, "ExecuteTemplate", "nodObj.Padding(-1) = 0");
			_ObjectSetProperty( node , "FixedWidth", 72);
			_ObjectSetProperty( node , "BackColor", 33554432);
	node = _ObjectCallMethod( nodes , "Add", "2.1.2 Cure & Strip Forms","Excavate","CureForms");
		_ObjectSetProperty( node , "BackColor", 50331648);
		_ObjectCallMethod(chartview, "TemplatePut", "Dim nodObj")
		_ObjectCallMethod(chartview, "TemplatePut", node)
		_ObjectCallMethod(chartview, "ExecuteTemplate", "nodObj.Padding(-1) = 0");
		node = _ObjectCallMethod( node , "AddAssistant", "<font ;6>Work:<r>10.30%<br>Budget:<r>$70,000.00");
			_ObjectSetProperty( node , "Left", 0);
			_ObjectSetProperty( node , "ShowLinks", 0);
			_ObjectCallMethod(chartview, "TemplatePut", "Dim nodObj")
			_ObjectCallMethod(chartview, "TemplatePut", node)
			_ObjectCallMethod(chartview, "ExecuteTemplate", "nodObj.Padding(-1) = 0");
			_ObjectSetProperty( node , "FixedWidth", 72);
			_ObjectSetProperty( node , "BackColor", 33554432);
	node = _ObjectCallMethod( nodes , "Add", "2.2 Steel Erection","Foundation","Steel");
		_ObjectSetProperty( node , "ShowRoundLink", 0);
		_ObjectSetProperty( node , "BackColor", 16842496);
		_ObjectSetProperty( node , "ForeColor", 16777215);
		node = _ObjectCallMethod( node , "AddAssistant", "<font ;6>Work:<r>5.00%<br>Budget:<r>$9,000.00");
			_ObjectSetProperty( node , "Left", 0);
			_ObjectSetProperty( node , "ShowLinks", 0);
			_ObjectCallMethod(chartview, "ExecuteTemplate", "nodObj.Padding(-1) = 0");
			_ObjectSetProperty( node , "FixedWidth", 72);
			_ObjectSetProperty( node , "BackColor", 33554432);
	node = _ObjectCallMethod( nodes , "Add", "2.2.1 Steel Columns","Steel","SteelColumns");
		_ObjectSetProperty( node , "BackColor", 50331648);
		_ObjectCallMethod(chartview, "TemplatePut", "Dim nodObj")
		_ObjectCallMethod(chartview, "TemplatePut", node)
		_ObjectCallMethod(chartview, "ExecuteTemplate", "nodObj.Padding(-1) = 0");
		node = _ObjectCallMethod( node , "AddAssistant", "<font ;6>Work:<r>2.80%<br>Budget:<r>$50,000.00");
			_ObjectSetProperty( node , "Left", 0);
			_ObjectSetProperty( node , "ShowLinks", 0);
			_ObjectCallMethod(chartview, "TemplatePut", "Dim nodObj")
			_ObjectCallMethod(chartview, "TemplatePut", node)
			_ObjectCallMethod(chartview, "ExecuteTemplate", "nodObj.Padding(-1) = 0");
			_ObjectSetProperty( node , "FixedWidth", 72);
			_ObjectSetProperty( node , "BackColor", 33554432);
	node = _ObjectCallMethod( nodes , "Add", "2.2.2 Beams","Steel","Beams");
		_ObjectSetProperty( node , "Width", 256);
		_ObjectSetProperty( node , "BackColor", 50331648);
		_ObjectCallMethod(chartview, "TemplatePut", "Dim nodObj")
		_ObjectCallMethod(chartview, "TemplatePut", node)
		_ObjectCallMethod(chartview, "ExecuteTemplate", "nodObj.Padding(-1) = 0");
		node = _ObjectCallMethod( node , "AddAssistant", "<font ;6>Work:<r>1.90%<br>Budget:<r>$2,000.00");
			_ObjectSetProperty( node , "Left", 0);
			_ObjectSetProperty( node , "ShowLinks", 0);
			_ObjectCallMethod(chartview, "TemplatePut", "Dim nodObj")
			_ObjectCallMethod(chartview, "TemplatePut", node)
			_ObjectCallMethod(chartview, "ExecuteTemplate", "nodObj.Padding(-1) = 0");
			_ObjectSetProperty( node , "FixedWidth", 72);
			_ObjectSetProperty( node , "BackColor", 33554432);
	node = _ObjectCallMethod( nodes , "Add", "2.2.3 Joist","Steel","Joist");
		_ObjectSetProperty( node , "BackColor", 50331648);
		_ObjectCallMethod(chartview, "TemplatePut", "Dim nodObj")
		_ObjectCallMethod(chartview, "TemplatePut", node)
		_ObjectCallMethod(chartview, "ExecuteTemplate", "nodObj.Padding(-1) = 0");
		node = _ObjectCallMethod( node , "AddAssistant", "<font ;6>Work:<r>1.10%<br>Budget:<r>$2,000.00");
			_ObjectSetProperty( node , "Left", 0);
			_ObjectSetProperty( node , "ShowLinks", 0);
			_ObjectCallMethod(chartview, "TemplatePut", "Dim nodObj")
			_ObjectCallMethod(chartview, "TemplatePut", node)
			_ObjectCallMethod(chartview, "ExecuteTemplate", "nodObj.Padding(-1) = 0");
			_ObjectSetProperty( node , "FixedWidth", 72);
			_ObjectSetProperty( node , "BackColor", 33554432);
	node = _ObjectCallMethod( nodes , "Add", "3. External","Root","External");
		_ObjectSetProperty( node , "ArrangeSiblingNodesAs", 2);
		_ObjectSetProperty( node , "ShowRoundLink", 0);
		_ObjectSetProperty( node , "BackColor", 33488896);
		_ObjectSetProperty( node , "ForeColor", 16777215);
		node = _ObjectCallMethod( node , "AddAssistant", "<font ;6>Work:<r>30.40%<br>Budget:<r>$83,500.00");
			_ObjectSetProperty( node , "Left", 0);
			_ObjectSetProperty( node , "ShowLinks", 0);
			_ObjectCallMethod(chartview, "ExecuteTemplate", "nodObj.Padding(-1) = 0");
			_ObjectSetProperty( node , "FixedWidth", 72);
			_ObjectSetProperty( node , "BackColor", 33554432);
	node = _ObjectCallMethod( nodes , "Add", "3.1 Masonry Work","External","Masonry");
		_ObjectSetProperty( node , "ShowRoundLink", 0);
		_ObjectSetProperty( node , "BackColor", 16842496);
		_ObjectSetProperty( node , "ForeColor", 16777215);
		node = _ObjectCallMethod( node , "AddAssistant", "<font ;6>Work:<r>16.20%<br>Budget:<r>$16,000.00");
			_ObjectSetProperty( node , "Left", 0);
			_ObjectSetProperty( node , "ShowLinks", 0);
			_ObjectCallMethod(chartview, "ExecuteTemplate", "nodObj.Padding(-1) = 0");
			_ObjectSetProperty( node , "FixedWidth", 72);
			_ObjectSetProperty( node , "BackColor", 33554432);
	node = _ObjectCallMethod( nodes , "Add", "3.1.1 Lay Masonry","Masonry","LayMasonry");
		_ObjectSetProperty( node , "BackColor", 50331648);
		_ObjectCallMethod(chartview, "TemplatePut", "Dim nodObj")
		_ObjectCallMethod(chartview, "TemplatePut", node)
		_ObjectCallMethod(chartview, "ExecuteTemplate", "nodObj.Padding(-1) = 0");
		node = _ObjectCallMethod( node , "AddAssistant", "<font ;6>Work:<r>9.00%<br>Budget:<r>$35,000.00");
			_ObjectSetProperty( node , "Left", 0);
			_ObjectSetProperty( node , "ShowLinks", 0);
			_ObjectCallMethod(chartview, "TemplatePut", "Dim nodObj")
			_ObjectCallMethod(chartview, "TemplatePut", node)
			_ObjectCallMethod(chartview, "ExecuteTemplate", "nodObj.Padding(-1) = 0");
			_ObjectSetProperty( node , "FixedWidth", 72);
			_ObjectSetProperty( node , "BackColor", 33554432);
	node = _ObjectCallMethod( nodes , "Add", "3.1.2 Install roof drains","Masonry","RoofDrains");
		_ObjectSetProperty( node , "BackColor", 50331648);
		_ObjectCallMethod(chartview, "TemplatePut", "Dim nodObj")
		_ObjectCallMethod(chartview, "TemplatePut", node)
		_ObjectCallMethod(chartview, "ExecuteTemplate", "nodObj.Padding(-1) = 0");
		node = _ObjectCallMethod( node , "AddAssistant", "<font ;6>Work:<r>3.10%<br>Budget:<r>$2,000.00");
			_ObjectSetProperty( node , "Left", 0);
			_ObjectSetProperty( node , "ShowLinks", 0);
			_ObjectCallMethod(chartview, "TemplatePut", "Dim nodObj")
			_ObjectCallMethod(chartview, "TemplatePut", node)
			_ObjectCallMethod(chartview, "ExecuteTemplate", "nodObj.Padding(-1) = 0");
			_ObjectSetProperty( node , "FixedWidth", 72);
			_ObjectSetProperty( node , "BackColor", 33554432);
	node = _ObjectCallMethod( nodes , "Add", "3.1.3 Install tile in toilet rooms","Masonry","TileToiles");
		_ObjectSetProperty( node , "BackColor", 50331648);
		_ObjectCallMethod(chartview, "TemplatePut", "Dim nodObj")
		_ObjectCallMethod(chartview, "TemplatePut", node)
		_ObjectCallMethod(chartview, "ExecuteTemplate", "nodObj.Padding(-1) = 0");
		node = _ObjectCallMethod( node , "AddAssistant", "<font ;6>Work:<r>1.30%<br>Budget:<r>$10,000.00");
			_ObjectSetProperty( node , "Left", 0);
			_ObjectSetProperty( node , "ShowLinks", 0);
			_ObjectCallMethod(chartview, "TemplatePut", "Dim nodObj")
			_ObjectCallMethod(chartview, "TemplatePut", node)
			_ObjectCallMethod(chartview, "ExecuteTemplate", "nodObj.Padding(-1) = 0");
			_ObjectSetProperty( node , "FixedWidth", 72);
			_ObjectSetProperty( node , "BackColor", 33554432);
	node = _ObjectCallMethod( nodes , "Add", "3.1.4 Roofing","Masonry","Roofing");
		_ObjectSetProperty( node , "BackColor", 50331648);
		_ObjectCallMethod(chartview, "TemplatePut", "Dim nodObj")
		_ObjectCallMethod(chartview, "TemplatePut", node)
		_ObjectCallMethod(chartview, "ExecuteTemplate", "nodObj.Padding(-1) = 0");
		node = _ObjectCallMethod( node , "AddAssistant", "<font ;6>Work:<r>2.80%<br>Budget:<r>$15,000.00");
			_ObjectSetProperty( node , "Left", 0);
			_ObjectSetProperty( node , "ShowLinks", 0);
			_ObjectCallMethod(chartview, "TemplatePut", "Dim nodObj")
			_ObjectCallMethod(chartview, "TemplatePut", node)
			_ObjectCallMethod(chartview, "ExecuteTemplate", "nodObj.Padding(-1) = 0");
			_ObjectSetProperty( node , "FixedWidth", 72);
			_ObjectSetProperty( node , "BackColor", 33554432);
	node = _ObjectCallMethod( nodes , "Add", "3.2 Building Finishes","External","Building");
		_ObjectSetProperty( node , "ShowRoundLink", 0);
		_ObjectSetProperty( node , "BackColor", 16842496);
		_ObjectSetProperty( node , "ForeColor", 16777215);
		node = _ObjectCallMethod( node , "AddAssistant", "<font ;6>Work:<r>14.20%<br>Budget:<r>$21,500.00");
			_ObjectSetProperty( node , "Left", 0);
			_ObjectSetProperty( node , "ShowLinks", 0);
			_ObjectCallMethod(chartview, "ExecuteTemplate", "nodObj.Padding(-1) = 0");
			_ObjectSetProperty( node , "FixedWidth", 72);
			_ObjectSetProperty( node , "BackColor", 33554432);
	node = _ObjectCallMethod( nodes , "Add", "3.2.1 Paint Walls","Building","Paint");
		_ObjectSetProperty( node , "BackColor", 50331648);
		_ObjectCallMethod(chartview, "TemplatePut", "Dim nodObj")
		_ObjectCallMethod(chartview, "TemplatePut", node)
		_ObjectCallMethod(chartview, "ExecuteTemplate", "nodObj.Padding(-1) = 0");
		node = _ObjectCallMethod( node , "AddAssistant", "<font ;6>Work:<r>4.00%<br>Budget:<r>$8,000.00");
			_ObjectSetProperty( node , "Left", 0);
			_ObjectSetProperty( node , "ShowLinks", 0);
			_ObjectCallMethod(chartview, "TemplatePut", "Dim nodObj")
			_ObjectCallMethod(chartview, "TemplatePut", node)
			_ObjectCallMethod(chartview, "ExecuteTemplate", "nodObj.Padding(-1) = 0");
			_ObjectSetProperty( node , "FixedWidth", 72);
			_ObjectSetProperty( node , "BackColor", 33554432);
	node = _ObjectCallMethod( nodes , "Add", "3.2.2 Ceiling Tiles","Building","CeilingTiles");
		_ObjectSetProperty( node , "Width", 256);
		_ObjectSetProperty( node , "BackColor", 50331648);
		_ObjectCallMethod(chartview, "TemplatePut", "Dim nodObj")
		_ObjectCallMethod(chartview, "TemplatePut", node)
		_ObjectCallMethod(chartview, "ExecuteTemplate", "nodObj.Padding(-1) = 0");
		node = _ObjectCallMethod( node , "AddAssistant", "<font ;6>Work:<r>3.60%<br>Budget:<r>$4,000.00");
			_ObjectSetProperty( node , "Left", 0);
			_ObjectSetProperty( node , "ShowLinks", 0);
			_ObjectCallMethod(chartview, "TemplatePut", "Dim nodObj")
			_ObjectCallMethod(chartview, "TemplatePut", node)
			_ObjectCallMethod(chartview, "ExecuteTemplate", "nodObj.Padding(-1) = 0");
			_ObjectSetProperty( node , "FixedWidth", 72);
			_ObjectSetProperty( node , "BackColor", 33554432);
	node = _ObjectCallMethod( nodes , "Add", "3.2.3 Hang Wallpaper","Building","Wallpaper");
		_ObjectSetProperty( node , "BackColor", 50331648);
		_ObjectCallMethod(chartview, "TemplatePut", "Dim nodObj")
		_ObjectCallMethod(chartview, "TemplatePut", node)
		_ObjectCallMethod(chartview, "ExecuteTemplate", "nodObj.Padding(-1) = 0");
		node = _ObjectCallMethod( node , "AddAssistant", "<font ;6>Work:<r>2.30%<br>Budget:<r>$1,500.00");
			_ObjectSetProperty( node , "Left", 0);
			_ObjectSetProperty( node , "ShowLinks", 0);
			_ObjectCallMethod(chartview, "TemplatePut", "Dim nodObj")
			_ObjectCallMethod(chartview, "TemplatePut", node)
			_ObjectCallMethod(chartview, "ExecuteTemplate", "nodObj.Padding(-1) = 0");
			_ObjectSetProperty( node , "FixedWidth", 72);
			_ObjectSetProperty( node , "BackColor", 33554432);
	node = _ObjectCallMethod( nodes , "Add", "3.2.4 Carpet","Building","Carpet");
		_ObjectSetProperty( node , "BackColor", 50331648);
		_ObjectCallMethod(chartview, "TemplatePut", "Dim nodObj")
		_ObjectCallMethod(chartview, "TemplatePut", node)
		_ObjectCallMethod(chartview, "ExecuteTemplate", "nodObj.Padding(-1) = 0");
		node = _ObjectCallMethod( node , "AddAssistant", "<font ;6>Work:<r>1.80%<br>Budget:<r>$6,000.00");
			_ObjectSetProperty( node , "Left", 0);
			_ObjectSetProperty( node , "ShowLinks", 0);
			_ObjectCallMethod(chartview, "TemplatePut", "Dim nodObj")
			_ObjectCallMethod(chartview, "TemplatePut", node)
			_ObjectCallMethod(chartview, "ExecuteTemplate", "nodObj.Padding(-1) = 0");
			_ObjectSetProperty( node , "FixedWidth", 72);
			_ObjectSetProperty( node , "BackColor", 33554432);
	node = _ObjectCallMethod( nodes , "Add", "3.2.5 Hardware","Building","Hardware");
		_ObjectSetProperty( node , "BackColor", 50331648);
		_ObjectCallMethod(chartview, "TemplatePut", "Dim nodObj")
		_ObjectCallMethod(chartview, "TemplatePut", node)
		_ObjectCallMethod(chartview, "ExecuteTemplate", "nodObj.Padding(-1) = 0");
		node = _ObjectCallMethod( node , "AddAssistant", "<font ;6>Work:<r>2.50%<br>Budget:<r>$2,000.00");
			_ObjectSetProperty( node , "Left", 0);
			_ObjectSetProperty( node , "ShowLinks", 0);
			_ObjectCallMethod(chartview, "TemplatePut", "Dim nodObj")
			_ObjectCallMethod(chartview, "TemplatePut", node)
			_ObjectCallMethod(chartview, "ExecuteTemplate", "nodObj.Padding(-1) = 0");
			_ObjectSetProperty( node , "FixedWidth", 72);
			_ObjectSetProperty( node , "BackColor", 33554432);
_ObjectCallMethod( chartview , "EndUpdate");
|
|
196
|
Does your control support padding (padding properties are used to generate space around content)
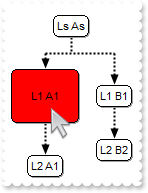
OBJECT chartview,node,nodes;

chartview =  ObjectByName("AN1") ;
_ObjectCallMethod( chartview , "BeginUpdate");
_ObjectSetProperty( chartview , "IndentSiblingY", 30);
_ObjectSetProperty( chartview , "ShowLinksDir", -1);
_ObjectSetProperty( chartview , "PenWidthLink", 2);
_ObjectSetProperty( chartview , "LinkColor", 0);
_ObjectSetProperty( chartview , "AntiAliasing", -1);
nodes = _ObjectGetProperty( chartview , "Nodes");
	node = _ObjectCallMethod( nodes , "Add", "L1 A1","","LA");
		_ObjectSetProperty( node , "BackColor", 255);
		_ObjectCallMethod(chartview, "TemplatePut", "Dim nodObj")
		_ObjectCallMethod(chartview, "TemplatePut", node)
		_ObjectCallMethod(chartview, "ExecuteTemplate", "nodObj.Padding(-1) = 16");
	_ObjectCallMethod( nodes , "Add", "L1 B1","","LB");
	_ObjectCallMethod( nodes , "Add", "L2 A1","LA","LA2");
	_ObjectCallMethod( nodes , "Add", "L2 B2","LB","LB2");
_ObjectCallMethod(chartview, "ExecuteTemplate", "Nodes.Item(`root`).Caption = `Ls As`");
_ObjectCallMethod( chartview , "EndUpdate");
|
|
195
|
Does your control support padding (padding properties are used to generate space around content)
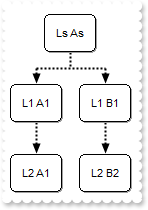
OBJECT chartview,nodes;

chartview =  ObjectByName("AN1") ;
_ObjectCallMethod( chartview , "BeginUpdate");
_ObjectCallMethod(chartview, "ExecuteTemplate", "DefaultNodePadding(-1) = 8");
_ObjectSetProperty( chartview , "IndentSiblingY", 30);
_ObjectSetProperty( chartview , "ShowLinksDir", -1);
_ObjectSetProperty( chartview , "PenWidthLink", 2);
_ObjectSetProperty( chartview , "LinkColor", 0);
_ObjectSetProperty( chartview , "AntiAliasing", -1);
nodes = _ObjectGetProperty( chartview , "Nodes");
	_ObjectCallMethod( nodes , "Add", "L1 A1","","LA");
	_ObjectCallMethod( nodes , "Add", "L1 B1","","LB");
	_ObjectCallMethod( nodes , "Add", "L2 A1","LA","LA2");
	_ObjectCallMethod( nodes , "Add", "L2 B2","LB","LB2");
_ObjectCallMethod(chartview, "ExecuteTemplate", "Nodes.Item(`root`).Caption = `Ls As`");
_ObjectCallMethod( chartview , "EndUpdate");
|
|
194
|
How do I programmatically edit a node
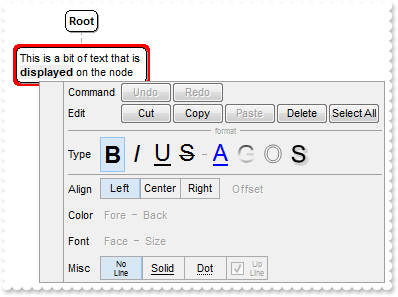
OBJECT chartview;

chartview =  ObjectByName("AN1") ;
_ObjectCallMethod( _ObjectGetProperty( chartview , "Nodes") , "Add", "Text","","1234");
_ObjectCallMethod( chartview , "EditNode", "1234");
|
|
193
|
WidthNode does not seem to do anything. What this property is for
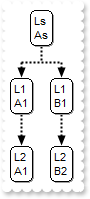
OBJECT chartview,nodes;

chartview =  ObjectByName("AN1") ;
_ObjectSetProperty( chartview , "WidthNode", 16);
_ObjectSetProperty( chartview , "IndentSiblingY", 30);
_ObjectSetProperty( chartview , "ShowLinksDir", -1);
_ObjectSetProperty( chartview , "PenWidthLink", 2);
_ObjectSetProperty( chartview , "LinkColor", 0);
_ObjectSetProperty( chartview , "AntiAliasing", -1);
nodes = _ObjectGetProperty( chartview , "Nodes");
	_ObjectCallMethod( nodes , "Add", "L1 A1","","LA");
	_ObjectCallMethod( nodes , "Add", "L1 B1","","LB");
	_ObjectCallMethod( nodes , "Add", "L2 A1","LA","LA2");
	_ObjectCallMethod( nodes , "Add", "L2 B2","LB","LB2");
_ObjectCallMethod(chartview, "ExecuteTemplate", "Nodes.Item(`root`).Caption = `Ls As`");
|
|
192
|
Does your control support Print and Print-Preview, such as Fit-To-Page
OBJECT chartview,createobject("exontrol.print"),nodes;

chartview =  ObjectByName("AN1") ;
_ObjectSetProperty( chartview , "FixedWidthNode", 512);
_ObjectSetProperty( chartview , "IndentSiblingY", 30);
_ObjectSetProperty( chartview , "ShowLinksDir", -1);
_ObjectSetProperty( chartview , "PenWidthLink", 2);
_ObjectSetProperty( chartview , "LinkColor", 0);
_ObjectSetProperty( chartview , "AntiAliasing", -1);
nodes = _ObjectGetProperty( chartview , "Nodes");
	_ObjectSetProperty( _ObjectCallMethod( nodes , "Add", "L1_A","","LA") , "ShowLinkDir", 0);
	_ObjectCallMethod( nodes , "Add", "L1_B","","LB");
	_ObjectCallMethod( nodes , "Add", "L2_A","LA","LA2");
	_ObjectCallMethod( nodes , "Add", "L2_B","LB","LB2");
createobject("exontrol.print") = CreateObject("Exontrol.Print");
	_ObjectSetProperty( createobject("exontrol.print") , "Options", "FitToPage = On");
	_ObjectSetProperty( createobject("exontrol.print") , "PrintExt", chartview);
	_ObjectCallMethod( createobject("exontrol.print") , "Preview");
|
|
191
|
Does your control support Print and Print-Preview
OBJECT chartview,createobject("exontrol.print"),nodes;

chartview =  ObjectByName("AN1") ;
_ObjectSetProperty( chartview , "IndentSiblingY", 30);
_ObjectSetProperty( chartview , "ShowLinksDir", -1);
_ObjectSetProperty( chartview , "PenWidthLink", 2);
_ObjectSetProperty( chartview , "LinkColor", 0);
_ObjectSetProperty( chartview , "AntiAliasing", -1);
nodes = _ObjectGetProperty( chartview , "Nodes");
	_ObjectSetProperty( _ObjectCallMethod( nodes , "Add", "L1_A","","LA") , "ShowLinkDir", 0);
	_ObjectCallMethod( nodes , "Add", "L1_B","","LB");
	_ObjectCallMethod( nodes , "Add", "L2_A","LA","LA2");
	_ObjectCallMethod( nodes , "Add", "L2_B","LB","LB2");
createobject("exontrol.print") = CreateObject("Exontrol.Print");
	_ObjectSetProperty( createobject("exontrol.print") , "PrintExts", chartview);
	_ObjectCallMethod( createobject("exontrol.print") , "Preview");
|
|
190
|
Does your control support subscript or superscript, in HTML captions
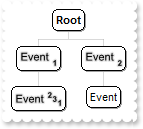
OBJECT chartview,nodes;

chartview =  ObjectByName("AN1") ;
_ObjectSetProperty( chartview , "AntiAliasing", -1);
nodes = _ObjectGetProperty( chartview , "Nodes");
	_ObjectSetProperty( _ObjectCallMethod( nodes , "Add", "<sha ;;0>Event <b><font ;6><off 4>1","","LA") , "ShowLinkDir", 0);
	_ObjectCallMethod( nodes , "Add", "<sha ;;0>Event <b><font ;6><off 4>2","","LB");
	_ObjectCallMethod( nodes , "Add", "<sha ;;0>Event <b><font ;6><off -6>2<off 4>3<off 4>1","LA","LA2");
	_ObjectCallMethod( nodes , "Add", "Event","LB","LB2");
|
|
189
|
Is it possible to move a node by a simple click rather than SHIFT + Click
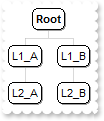
OBJECT chartview,nodes;

chartview =  ObjectByName("AN1") ;
_ObjectSetProperty( chartview , "AllowMoveChart", 0);
_ObjectSetProperty( chartview , "AllowMoveNode", 1);
_ObjectSetProperty( chartview , "AntiAliasing", -1);
nodes = _ObjectGetProperty( chartview , "Nodes");
	_ObjectSetProperty( _ObjectCallMethod( nodes , "Add", "L1_A","","LA") , "ShowLinkDir", 0);
	_ObjectCallMethod( nodes , "Add", "L1_B","","LB");
	_ObjectCallMethod( nodes , "Add", "L2_A","LA","LA2");
	_ObjectCallMethod( nodes , "Add", "L2_B","LB","LB2");
|
|
188
|
How can I disable moving the nodes at runtime
OBJECT chartview;

chartview =  ObjectByName("AN1") ;
_ObjectSetProperty( chartview , "AllowMoveNode", 0);
|
|
187
|
How can I disable resizing the chart using the middle mouse button
OBJECT chartview;

chartview =  ObjectByName("AN1") ;
_ObjectSetProperty( chartview , "AllowResizeChart", 0);
|
|
186
|
How can I disable inline editing
OBJECT chartview;

chartview =  ObjectByName("AN1") ;
_ObjectSetProperty( chartview , "AllowEdit", 0);
|
|
185
|
Would like to be able to click on a node and have a pop-up window appear with additional detail and information about the individual in the node. Is this possible
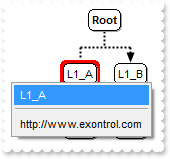
// MouseUp event - Occurs when the user releases a mouse button.
FUNCTION chartviewEvents_MouseUp(OBJECT chartview, INT Button, INT Shift, INT X, INT Y)
	' Items.Add(Me.NodeFromPoint(-1,-1).Caption,0,1234)
	OBJECT createobject("exontrol.expopupmenu");
	createobject("exontrol.expopupmenu") = CreateObject("Exontrol.ExPopupMenu");
		Message( _ObjectGetProperty( createobject("exontrol.expopupmenu") , "ShowAtCursor") );
END

OBJECT chartview,nodes;

chartview =  ObjectByName("AN1") ;
ObjectAssociateEvents("chartviewEvents", chartview);
_ObjectSetProperty( chartview , "IndentSiblingY", 30);
_ObjectSetProperty( chartview , "ShowLinksDir", -1);
_ObjectSetProperty( chartview , "PenWidthLink", 2);
_ObjectSetProperty( chartview , "LinkColor", 0);
_ObjectSetProperty( chartview , "AntiAliasing", -1);
nodes = _ObjectGetProperty( chartview , "Nodes");
	_ObjectSetProperty( _ObjectCallMethod( nodes , "Add", "L1_A","","LA") , "ShowLinkDir", 0);
	_ObjectCallMethod( nodes , "Add", "L1_B","","LB");
	_ObjectCallMethod( nodes , "Add", "L2_A","LA","LA2");
	_ObjectCallMethod( nodes , "Add", "L2_B","LB","LB2");
|
|
184
|
I am trying to create a hyperlink. I can get the link but I cannot tell the link where to go. What can I do

// AnchorClick event - Occurs when an anchor element is clicked.
FUNCTION chartviewEvents_AnchorClick(OBJECT chartview, STRING AnchorID, STRING Options)
	Message( Options );
END

OBJECT chartview,nodes;

chartview =  ObjectByName("AN1") ;
ObjectAssociateEvents("chartviewEvents", chartview);
_ObjectSetProperty( _ObjectGetProperty( chartview , "Root") , "Image", 0);
nodes = _ObjectGetProperty( chartview , "Nodes");
	_ObjectCallMethod( nodes , "Add", "<a;http://www.exontrol.com>exontrol</a>","","1234");
|
|
183
|
Is it possible to put a caption on the regular links
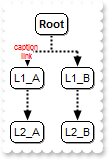
OBJECT chartview,nodes;

chartview =  ObjectByName("AN1") ;
_ObjectSetProperty( chartview , "IndentSiblingY", 30);
_ObjectSetProperty( chartview , "ShowLinksDir", -1);
_ObjectSetProperty( chartview , "PenWidthLink", 2);
_ObjectSetProperty( chartview , "LinkColor", 0);
_ObjectSetProperty( chartview , "AntiAliasing", -1);
nodes = _ObjectGetProperty( chartview , "Nodes");
	_ObjectSetProperty( _ObjectCallMethod( nodes , "Add", "L1_A","","LA") , "LinkCaption", "<fgcolor=FF0000><font ;6>caption<br><c><bgcolor=FFFFFF><a>link");
	_ObjectCallMethod( nodes , "Add", "L1_B","","LB");
	_ObjectCallMethod( nodes , "Add", "L2_A","LA","LA2");
	_ObjectCallMethod( nodes , "Add", "L2_B","LB","LB2");
|
|
182
|
Is it possible to hide directions for specific links
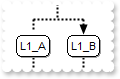
OBJECT chartview,nodes;

chartview =  ObjectByName("AN1") ;
_ObjectSetProperty( chartview , "IndentSiblingY", 30);
_ObjectSetProperty( chartview , "ShowLinksDir", -1);
_ObjectSetProperty( chartview , "PenWidthLink", 2);
_ObjectSetProperty( chartview , "LinkColor", 0);
_ObjectSetProperty( chartview , "AntiAliasing", -1);
nodes = _ObjectGetProperty( chartview , "Nodes");
	_ObjectSetProperty( _ObjectCallMethod( nodes , "Add", "L1_A","","LA") , "ShowLinkDir", 0);
	_ObjectCallMethod( nodes , "Add", "L1_B","","LB");
	_ObjectCallMethod( nodes , "Add", "L2_A","LA","LA2");
	_ObjectCallMethod( nodes , "Add", "L2_B","LB","LB2");
|
|
181
|
Does your control supports multiple lines tooltip
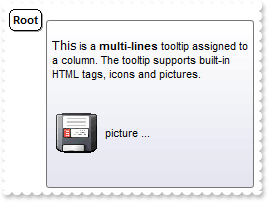
OBJECT chartview;

chartview =  ObjectByName("AN1") ;
_ObjectCallMethod(chartview, "ExecuteTemplate", "HTMLPicture(`pic1`) = `c:\exontrol\images\zipdisk.gif`");
_ObjectSetProperty( chartview , "ToolTipDelay", 1);
_ObjectSetProperty( _ObjectGetProperty( chartview , "Root") , "ToolTip", "<br><font Tahoma;10>This</font> is a <b>multi-lines</b> tooltip assigned to a column. The tooltip supports built-in HTML tags, " +
	"icons and pictures.<br><br><br><img>pic1</img> picture ... <br><br>");
|
|
180
|
Can I change the border's node, using your EBN technology, including specifying a color
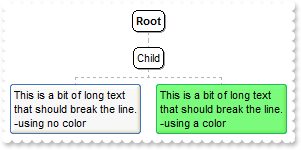
OBJECT chartview,node,nodes;

chartview =  ObjectByName("AN1") ;
_ObjectCallMethod( _ObjectGetProperty( chartview , "VisualAppearance") , "Add", 1,"c:\exontrol\images\hot.ebn");
nodes = _ObjectGetProperty( chartview , "Nodes");
	_ObjectCallMethod( nodes , "Add", "Child","","1234");
	node = _ObjectCallMethod( nodes , "Add", "Sub 1","1234");
		_ObjectSetProperty( node , "Caption", "This is a bit of long text that should break the line.<br>-using no color");
		_ObjectSetProperty( node , "BackColor", 16777216);
	node = _ObjectCallMethod( nodes , "Add", "Sub 2","1234");
		_ObjectSetProperty( node , "Caption", "This is a bit of long text that should break the line.<br>-using a color");
		_ObjectSetProperty( node , "BackColor", 16842496);
|
|
179
|
Can the chart be arranged from the left to right (LTR)
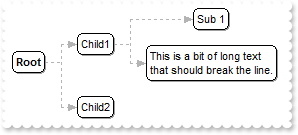
OBJECT chartview,nodes;

chartview =  ObjectByName("AN1") ;
_ObjectCallMethod( chartview , "BeginUpdate");
_ObjectSetProperty( chartview , "Layout", 1);
_ObjectSetProperty( chartview , "ShowLinksDir", 1);
_ObjectSetProperty( chartview , "IndentSiblingX", 32);
nodes = _ObjectGetProperty( chartview , "Nodes");
	_ObjectCallMethod( nodes , "Add", "Child1","","1234");
	_ObjectCallMethod( nodes , "Add", "Child2","","1235");
	_ObjectCallMethod( nodes , "Add", "Sub 1","1234");
	_ObjectSetProperty( _ObjectCallMethod( nodes , "Add", "Sub 2","1234") , "Caption", "This is a bit of long text that should break the line.");
_ObjectCallMethod( chartview , "EndUpdate");
|
|
178
|
Is there any property to keep the aspect ratio for all pictures, but still keep the size of nodes
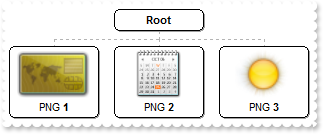
OBJECT chartview,node,nodes;

chartview =  ObjectByName("AN1") ;
_ObjectCallMethod( chartview , "BeginUpdate");
_ObjectSetProperty( chartview , "PictureHeightNode", 48);
_ObjectSetProperty( chartview , "PictureAspectRatioNode", 2);
_ObjectSetProperty( chartview , "FixedWidthNode", 82);
nodes = _ObjectGetProperty( chartview , "Nodes");
	node = _ObjectCallMethod( nodes , "Add", "PNG <b>1","","0");
		_ObjectSetProperty( node , "Picture", "c:\exontrol\images\card.png");
		_ObjectSetProperty( node , "Alignment", 1);
	node = _ObjectCallMethod( nodes , "Add", "PNG <b>2","","1");
		_ObjectSetProperty( node , "Picture", "c:\exontrol\images\diary.png");
		_ObjectSetProperty( node , "Alignment", 1);
	node = _ObjectCallMethod( nodes , "Add", "PNG <b>3","","2");
		_ObjectSetProperty( node , "Picture", "c:\exontrol\images\sun.png");
		_ObjectSetProperty( node , "Alignment", 1);
_ObjectSetProperty( _ObjectGetProperty( chartview , "Root") , "Alignment", 1);
_ObjectCallMethod( chartview , "EndUpdate");
|
|
177
|
Is there any property to keep the aspect ratio for all pictures
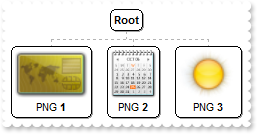
OBJECT chartview,node,nodes;

chartview =  ObjectByName("AN1") ;
_ObjectCallMethod( chartview , "BeginUpdate");
_ObjectSetProperty( chartview , "PictureHeightNode", 48);
_ObjectSetProperty( chartview , "PictureAspectRatioNode", 2);
nodes = _ObjectGetProperty( chartview , "Nodes");
	node = _ObjectCallMethod( nodes , "Add", "PNG <b>1","","0");
		_ObjectSetProperty( node , "Picture", "c:\exontrol\images\card.png");
	node = _ObjectCallMethod( nodes , "Add", "PNG <b>2","","1");
		_ObjectSetProperty( node , "Picture", "c:\exontrol\images\diary.png");
	node = _ObjectCallMethod( nodes , "Add", "PNG <b>3","","2");
		_ObjectSetProperty( node , "Picture", "c:\exontrol\images\sun.png");
_ObjectCallMethod( chartview , "EndUpdate");
|
|
176
|
Is there any property to keep the aspect ratio for all pictures
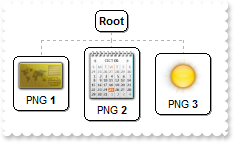
OBJECT chartview,node,nodes;

chartview =  ObjectByName("AN1") ;
_ObjectCallMethod( chartview , "BeginUpdate");
_ObjectSetProperty( chartview , "PictureWidthNode", 48);
_ObjectSetProperty( chartview , "PictureAspectRatioNode", 1);
nodes = _ObjectGetProperty( chartview , "Nodes");
	node = _ObjectCallMethod( nodes , "Add", "PNG <b>1","","0");
		_ObjectSetProperty( node , "Picture", "c:\exontrol\images\card.png");
	node = _ObjectCallMethod( nodes , "Add", "PNG <b>2","","1");
		_ObjectSetProperty( node , "Picture", "c:\exontrol\images\diary.png");
	node = _ObjectCallMethod( nodes , "Add", "PNG <b>3","","2");
		_ObjectSetProperty( node , "Picture", "c:\exontrol\images\sun.png");
_ObjectCallMethod( chartview , "EndUpdate");
|
|
175
|
Is there any property to keep the aspect ratio for displayed picture
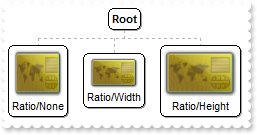
OBJECT chartview,node,nodes;

chartview =  ObjectByName("AN1") ;
_ObjectCallMethod( chartview , "BeginUpdate");
nodes = _ObjectGetProperty( chartview , "Nodes");
	node = _ObjectCallMethod( nodes , "Add", "Ratio/None","","0");
		_ObjectSetProperty( node , "Picture", "c:\exontrol\images\card.png");
		_ObjectSetProperty( node , "PictureWidth", 48);
		_ObjectSetProperty( node , "PictureHeight", 48);
	node = _ObjectCallMethod( nodes , "Add", "Ratio/Width","","1");
		_ObjectSetProperty( node , "Picture", "c:\exontrol\images\card.png");
		_ObjectSetProperty( node , "PictureWidth", 48);
		_ObjectSetProperty( node , "PictureAspectRatio", 1);
	node = _ObjectCallMethod( nodes , "Add", "Ratio/Height","","2");
		_ObjectSetProperty( node , "Picture", "c:\exontrol\images\card.png");
		_ObjectSetProperty( node , "PictureHeight", 48);
		_ObjectSetProperty( node , "PictureAspectRatio", 2);
_ObjectCallMethod( chartview , "EndUpdate");
|
|
174
|
Is is possible to show the round an arbitrary link
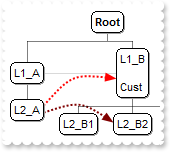
OBJECT chartview,node,nodes;

chartview =  ObjectByName("AN1") ;
_ObjectSetProperty( chartview , "AntiAliasing", -1);
_ObjectSetProperty( chartview , "ShowLinksDir", 0);
_ObjectSetProperty( chartview , "PenWidthLink", 1);
_ObjectSetProperty( chartview , "LinkColor", 0);
nodes = _ObjectGetProperty( chartview , "Nodes");
	_ObjectSetProperty( _ObjectCallMethod( nodes , "Add", "L1_A","","LA") , "LinkTo", "LB");
	_ObjectCallMethod( nodes , "Add", "L1_B<br><br>Cust","","LB");
	node = _ObjectCallMethod( nodes , "Add", "L2_A","LA","LA2");
		_ObjectSetProperty( node , "LinkTo", "LB,LB22");
		_ObjectCallMethod(chartview, "TemplatePut", "Dim nodObj")
		_ObjectCallMethod(chartview, "TemplatePut", node)
		_ObjectCallMethod(chartview, "ExecuteTemplate", "nodObj.LinkToColor(`LB`) = 255");
		_ObjectCallMethod(chartview, "ExecuteTemplate", "nodObj.LinkToWidth(`LB`) = 2");
		_ObjectCallMethod(chartview, "ExecuteTemplate", "nodObj.LinkToPen(`LB`) = 2");
		_ObjectCallMethod(chartview, "ExecuteTemplate", "nodObj.LinkToShowDir(`LB`) = True");
		_ObjectCallMethod(chartview, "ExecuteTemplate", "nodObj.LinkToRound(`LB`) = True");
		_ObjectCallMethod(chartview, "ExecuteTemplate", "nodObj.LinkToRound(`LB22`) = True");
		_ObjectCallMethod(chartview, "ExecuteTemplate", "nodObj.LinkToShowDir(`LB22`) = True");
		_ObjectCallMethod(chartview, "ExecuteTemplate", "nodObj.LinkToColor(`LB22`) = 128");
		_ObjectCallMethod(chartview, "ExecuteTemplate", "nodObj.LinkToWidth(`LB22`) = 2");
	_ObjectCallMethod( nodes , "Add", "L2_B1","LB","LB21");
	_ObjectCallMethod( nodes , "Add", "L2_B2","LB","LB22");
	_ObjectCallMethod( nodes , "Add", "L2_B3","LB","LB23");
|
|
173
|
Is is possible to show the round an arbitrary link
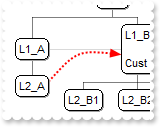
OBJECT chartview,node,nodes;

chartview =  ObjectByName("AN1") ;
_ObjectSetProperty( chartview , "AntiAliasing", -1);
_ObjectSetProperty( chartview , "ShowLinksDir", 0);
_ObjectSetProperty( chartview , "PenWidthLink", 1);
_ObjectSetProperty( chartview , "LinkColor", 0);
nodes = _ObjectGetProperty( chartview , "Nodes");
	_ObjectSetProperty( _ObjectCallMethod( nodes , "Add", "L1_A","","LA") , "LinkTo", "LB");
	_ObjectCallMethod( nodes , "Add", "L1_B<br><br>Cust","","LB");
	node = _ObjectCallMethod( nodes , "Add", "L2_A","LA","LA2");
		_ObjectSetProperty( node , "LinkTo", "LB");
		_ObjectCallMethod(chartview, "TemplatePut", "Dim nodObj")
		_ObjectCallMethod(chartview, "TemplatePut", node)
		_ObjectCallMethod(chartview, "ExecuteTemplate", "nodObj.LinkToColor(`LB`) = 255");
		_ObjectCallMethod(chartview, "ExecuteTemplate", "nodObj.LinkToWidth(`LB`) = 2");
		_ObjectCallMethod(chartview, "ExecuteTemplate", "nodObj.LinkToPen(`LB`) = 2");
		_ObjectCallMethod(chartview, "ExecuteTemplate", "nodObj.LinkToShowDir(`LB`) = True");
		_ObjectCallMethod(chartview, "ExecuteTemplate", "nodObj.LinkToRound(`LB`) = True");
	_ObjectCallMethod( nodes , "Add", "L2_B1","LB","LB21");
	_ObjectCallMethod( nodes , "Add", "L2_B2","LB","LB22");
	_ObjectCallMethod( nodes , "Add", "L2_B3","LB","LB23");
|
|
172
|
Is is possible to show the direction for a linktoline, even if the ShowLinksDir is False
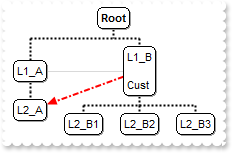
OBJECT chartview,node,nodes;

chartview =  ObjectByName("AN1") ;
_ObjectSetProperty( chartview , "ShowLinksDir", 0);
_ObjectSetProperty( chartview , "PenWidthLink", 2);
_ObjectSetProperty( chartview , "LinkColor", 0);
_ObjectSetProperty( chartview , "AntiAliasing", -1);
nodes = _ObjectGetProperty( chartview , "Nodes");
	_ObjectSetProperty( _ObjectCallMethod( nodes , "Add", "L1_A","","LA") , "LinkTo", "LB");
	node = _ObjectCallMethod( nodes , "Add", "L1_B<br><br>Cust","","LB");
		_ObjectSetProperty( node , "LinkTo", "LA2");
		_ObjectCallMethod(chartview, "TemplatePut", "Dim nodObj")
		_ObjectCallMethod(chartview, "TemplatePut", node)
		_ObjectCallMethod(chartview, "ExecuteTemplate", "nodObj.LinkToColor(`LA2`) = 255");
		_ObjectCallMethod(chartview, "ExecuteTemplate", "nodObj.LinkToWidth(`LA2`) = 2");
		_ObjectCallMethod(chartview, "ExecuteTemplate", "nodObj.LinkToPen(`LA2`) = 3");
		_ObjectCallMethod(chartview, "ExecuteTemplate", "nodObj.LinkToShowDir(`LA2`) = True");
	_ObjectCallMethod( nodes , "Add", "L2_A","LA","LA2");
	_ObjectCallMethod( nodes , "Add", "L2_B1","LB","LB21");
	_ObjectCallMethod( nodes , "Add", "L2_B2","LB","LB22");
	_ObjectCallMethod( nodes , "Add", "L2_B3","LB","LB23");
|
|
171
|
Is is possible to change the width for a specified linkto line
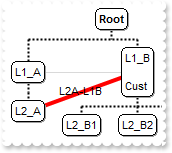
OBJECT chartview,node,nodes;

chartview =  ObjectByName("AN1") ;
_ObjectSetProperty( chartview , "PenWidthLink", 2);
_ObjectSetProperty( chartview , "LinkColor", 0);
_ObjectSetProperty( chartview , "AntiAliasing", -1);
nodes = _ObjectGetProperty( chartview , "Nodes");
	_ObjectSetProperty( _ObjectCallMethod( nodes , "Add", "L1_A","","LA") , "LinkTo", "LB");
	node = _ObjectCallMethod( nodes , "Add", "L1_B<br><br>Cust","","LB");
		_ObjectSetProperty( node , "LinkTo", "LA2");
		_ObjectCallMethod(chartview, "TemplatePut", "Dim nodObj")
		_ObjectCallMethod(chartview, "TemplatePut", node)
		_ObjectCallMethod(chartview, "ExecuteTemplate", "nodObj.LinkToColor(`LA2`) = 255");
		_ObjectCallMethod(chartview, "ExecuteTemplate", "nodObj.LinkToWidth(`LA2`) = 4");
		_ObjectCallMethod(chartview, "ExecuteTemplate", "nodObj.LinkToPen(`LA2`) = 0");
		_ObjectCallMethod(chartview, "ExecuteTemplate", "nodObj.LinkToCaption(`LA2`) = `L2A-L1B`");
	_ObjectCallMethod( nodes , "Add", "L2_A","LA","LA2");
	_ObjectCallMethod( nodes , "Add", "L2_B1","LB","LB21");
	_ObjectCallMethod( nodes , "Add", "L2_B2","LB","LB22");
	_ObjectCallMethod( nodes , "Add", "L2_B3","LB","LB23");
|
|
170
|
Is is possible to change the width for a specified linkto line
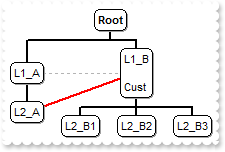
OBJECT chartview,node,nodes;

chartview =  ObjectByName("AN1") ;
_ObjectSetProperty( chartview , "PenWidthLink", 2);
_ObjectSetProperty( chartview , "LinkColor", 0);
nodes = _ObjectGetProperty( chartview , "Nodes");
	_ObjectSetProperty( _ObjectCallMethod( nodes , "Add", "L1_A","","LA") , "LinkTo", "LB");
	node = _ObjectCallMethod( nodes , "Add", "L1_B<br><br>Cust","","LB");
		_ObjectSetProperty( node , "LinkTo", "LA2");
		_ObjectCallMethod(chartview, "TemplatePut", "Dim nodObj")
		_ObjectCallMethod(chartview, "TemplatePut", node)
		_ObjectCallMethod(chartview, "ExecuteTemplate", "nodObj.LinkToColor(`LA2`) = 255");
		_ObjectCallMethod(chartview, "ExecuteTemplate", "nodObj.LinkToWidth(`LA2`) = 2");
	_ObjectCallMethod( nodes , "Add", "L2_A","LA","LA2");
	_ObjectCallMethod( nodes , "Add", "L2_B1","LB","LB21");
	_ObjectCallMethod( nodes , "Add", "L2_B2","LB","LB22");
	_ObjectCallMethod( nodes , "Add", "L2_B3","LB","LB23");
|
|
169
|
Is is possible to change the color for a specified linkto line
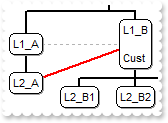
OBJECT chartview,node,nodes;

chartview =  ObjectByName("AN1") ;
_ObjectSetProperty( chartview , "PenWidthLink", 2);
_ObjectSetProperty( chartview , "LinkColor", 0);
nodes = _ObjectGetProperty( chartview , "Nodes");
	_ObjectSetProperty( _ObjectCallMethod( nodes , "Add", "L1_A","","LA") , "LinkTo", "LB");
	node = _ObjectCallMethod( nodes , "Add", "L1_B<br><br>Cust","","LB");
		_ObjectSetProperty( node , "LinkTo", "LA2");
		_ObjectCallMethod(chartview, "TemplatePut", "Dim nodObj")
		_ObjectCallMethod(chartview, "TemplatePut", node)
		_ObjectCallMethod(chartview, "ExecuteTemplate", "nodObj.LinkToColor(`LA2`) = 255");
		_ObjectCallMethod(chartview, "ExecuteTemplate", "nodObj.LinkToWidth(`LA2`) = 2");
	_ObjectCallMethod( nodes , "Add", "L2_A","LA","LA2");
	_ObjectCallMethod( nodes , "Add", "L2_B1","LB","LB21");
	_ObjectCallMethod( nodes , "Add", "L2_B2","LB","LB22");
	_ObjectCallMethod( nodes , "Add", "L2_B3","LB","LB23");
|
|
168
|
How can I specify the size for a picture being shown in a specified node only
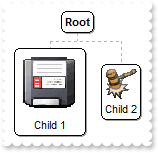
OBJECT chartview,node,nodes;

chartview =  ObjectByName("AN1") ;
nodes = _ObjectGetProperty( chartview , "Nodes");
	node = _ObjectCallMethod( nodes , "Add", "Child 1","","1");
		_ObjectSetProperty( node , "Picture", "c:\exontrol\images\zipdisk.gif");
		_ObjectSetProperty( node , "PictureWidth", 64);
		_ObjectSetProperty( node , "PictureHeight", 64);
	_ObjectSetProperty( _ObjectCallMethod( nodes , "Add", "Child 2","","2") , "Picture", "c:\exontrol\images\auction.gif");
|
|
167
|
How can I resize the pictures being shown in the nodes
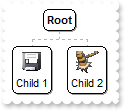
OBJECT chartview,nodes;

chartview =  ObjectByName("AN1") ;
_ObjectSetProperty( chartview , "PictureHeightNode", 24);
_ObjectSetProperty( chartview , "PictureWidthNode", 24);
nodes = _ObjectGetProperty( chartview , "Nodes");
	_ObjectSetProperty( _ObjectCallMethod( nodes , "Add", "Child 1","","1") , "Picture", "c:\exontrol\images\zipdisk.gif");
	_ObjectSetProperty( _ObjectCallMethod( nodes , "Add", "Child 2","","2") , "Picture", "c:\exontrol\images\auction.gif");
|
|
166
|
Can I change the width of the node's border
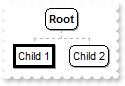
OBJECT chartview,node,nodes;

chartview =  ObjectByName("AN1") ;
nodes = _ObjectGetProperty( chartview , "Nodes");
	node = _ObjectCallMethod( nodes , "Add", "Child 1","","1");
		_ObjectSetProperty( node , "BorderWidth", 3);
		_ObjectSetProperty( node , "DrawRoundNode", 0);
	_ObjectCallMethod( nodes , "Add", "Child 2","","2");
|
|
165
|
Can I change the visual appearance of the node
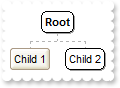
OBJECT chartview,nodes;

chartview =  ObjectByName("AN1") ;
_ObjectCallMethod( _ObjectGetProperty( chartview , "VisualAppearance") , "Add", 1,"c:\exontrol\images\normal.ebn");
nodes = _ObjectGetProperty( chartview , "Nodes");
	_ObjectSetProperty( _ObjectCallMethod( nodes , "Add", "Child 1","","1") , "BackColor", 16777216);
	_ObjectCallMethod( nodes , "Add", "Child 2","","2");
|
|
164
|
Can I specify a different color for node's border
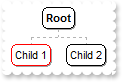
OBJECT chartview,nodes;

chartview =  ObjectByName("AN1") ;
nodes = _ObjectGetProperty( chartview , "Nodes");
	_ObjectSetProperty( _ObjectCallMethod( nodes , "Add", "Child 1","","1") , "BorderColor", 255);
	_ObjectCallMethod( nodes , "Add", "Child 2","","2");
|
|
163
|
Can I display my image on my links
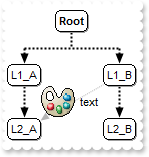
OBJECT chartview,node,nodes;

chartview =  ObjectByName("AN1") ;
_ObjectCallMethod(chartview, "ExecuteTemplate", "HTMLPicture(`pic1`) = `c:\exontrol\images\colorize.gif`");
_ObjectSetProperty( chartview , "AntiAliasing", -1);
_ObjectSetProperty( chartview , "IndentSiblingY", 30);
_ObjectSetProperty( chartview , "IndentSiblingX", 60);
_ObjectSetProperty( chartview , "ShowLinksDir", -1);
_ObjectSetProperty( chartview , "PenWidthLink", 2);
_ObjectSetProperty( chartview , "LinkColor", 0);
nodes = _ObjectGetProperty( chartview , "Nodes");
	_ObjectCallMethod( nodes , "Add", "L1_A","","LA");
	node = _ObjectCallMethod( nodes , "Add", "L1_B","","LB");
		_ObjectSetProperty( node , "LinkTo", "LA2");
		_ObjectCallMethod(chartview, "TemplatePut", "Dim nodObj")
		_ObjectCallMethod(chartview, "TemplatePut", node)
		_ObjectCallMethod(chartview, "ExecuteTemplate", "nodObj.LinkToCaption(`LA2`) = `<img>pic1</img> text`");
	_ObjectCallMethod( nodes , "Add", "L2_A","LA","LA2");
	_ObjectCallMethod( nodes , "Add", "L2_B","LB","LB2");
|
|
162
|
How can I show a caption on my link
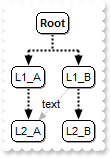
OBJECT chartview,node,nodes;

chartview =  ObjectByName("AN1") ;
_ObjectSetProperty( chartview , "AntiAliasing", -1);
_ObjectSetProperty( chartview , "IndentSiblingY", 30);
_ObjectSetProperty( chartview , "ShowLinksDir", -1);
_ObjectSetProperty( chartview , "PenWidthLink", 2);
_ObjectSetProperty( chartview , "LinkColor", 0);
nodes = _ObjectGetProperty( chartview , "Nodes");
	_ObjectCallMethod( nodes , "Add", "L1_A","","LA");
	node = _ObjectCallMethod( nodes , "Add", "L1_B","","LB");
		_ObjectSetProperty( node , "LinkTo", "LA2");
		_ObjectCallMethod(chartview, "TemplatePut", "Dim nodObj")
		_ObjectCallMethod(chartview, "TemplatePut", node)
		_ObjectCallMethod(chartview, "ExecuteTemplate", "nodObj.LinkToCaption(`LA2`) = `text`");
	_ObjectCallMethod( nodes , "Add", "L2_A","LA","LA2");
	_ObjectCallMethod( nodes , "Add", "L2_B","LB","LB2");
|
|
161
|
How can I show smootly the arrows
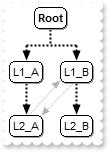
OBJECT chartview,nodes;

chartview =  ObjectByName("AN1") ;
_ObjectSetProperty( chartview , "AntiAliasing", -1);
_ObjectSetProperty( chartview , "IndentSiblingY", 30);
_ObjectSetProperty( chartview , "ShowLinksDir", -1);
_ObjectSetProperty( chartview , "PenWidthLink", 2);
_ObjectSetProperty( chartview , "LinkColor", 0);
nodes = _ObjectGetProperty( chartview , "Nodes");
	_ObjectCallMethod( nodes , "Add", "L1_A","","LA");
	_ObjectSetProperty( _ObjectCallMethod( nodes , "Add", "L1_B","","LB") , "LinkTo", "LA2");
	_ObjectSetProperty( _ObjectCallMethod( nodes , "Add", "L2_A","LA","LA2") , "LinkTo", "LB");
	_ObjectCallMethod( nodes , "Add", "L2_B","LB","LB2");
|
|
160
|
How can I show direction on my links
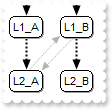
OBJECT chartview,nodes;

chartview =  ObjectByName("AN1") ;
_ObjectSetProperty( chartview , "IndentSiblingY", 30);
_ObjectSetProperty( chartview , "ShowLinksDir", -1);
_ObjectSetProperty( chartview , "PenWidthLink", 2);
_ObjectSetProperty( chartview , "LinkColor", 0);
_ObjectSetProperty( chartview , "AntiAliasing", -1);
nodes = _ObjectGetProperty( chartview , "Nodes");
	_ObjectCallMethod( nodes , "Add", "L1_A","","LA");
	_ObjectSetProperty( _ObjectCallMethod( nodes , "Add", "L1_B","","LB") , "LinkTo", "LA2");
	_ObjectSetProperty( _ObjectCallMethod( nodes , "Add", "L2_A","LA","LA2") , "LinkTo", "LB");
	_ObjectCallMethod( nodes , "Add", "L2_B","LB","LB2");
|
|
159
|
How can I add a doubled direction link
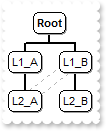
OBJECT chartview,nodes;

chartview =  ObjectByName("AN1") ;
_ObjectSetProperty( chartview , "PenWidthLink", 2);
_ObjectSetProperty( chartview , "LinkColor", 0);
nodes = _ObjectGetProperty( chartview , "Nodes");
	_ObjectCallMethod( nodes , "Add", "L1_A","","LA");
	_ObjectSetProperty( _ObjectCallMethod( nodes , "Add", "L1_B","","LB") , "LinkTo", "LA2");
	_ObjectSetProperty( _ObjectCallMethod( nodes , "Add", "L2_A","LA","LA2") , "LinkTo", "LB");
	_ObjectCallMethod( nodes , "Add", "L2_B","LB","LB2");
|
|
158
|
How can I add arbitrary links
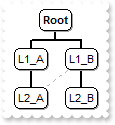
OBJECT chartview,nodes;

chartview =  ObjectByName("AN1") ;
_ObjectSetProperty( chartview , "PenWidthLink", 2);
_ObjectSetProperty( chartview , "LinkColor", 0);
nodes = _ObjectGetProperty( chartview , "Nodes");
	_ObjectCallMethod( nodes , "Add", "L1_A","","LA");
	_ObjectSetProperty( _ObjectCallMethod( nodes , "Add", "L1_B","","LB") , "LinkTo", "LA2");
	_ObjectCallMethod( nodes , "Add", "L2_A","LA","LA2");
	_ObjectCallMethod( nodes , "Add", "L2_B","LB","LB2");
|
|
157
|
How can I add multiple parents
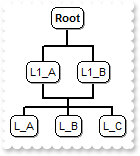
OBJECT chartview,nodes;

chartview =  ObjectByName("AN1") ;
_ObjectSetProperty( chartview , "PenWidthLink", 2);
_ObjectSetProperty( chartview , "LinkColor", 0);
nodes = _ObjectGetProperty( chartview , "Nodes");
	_ObjectCallMethod( _ObjectCallMethod( nodes , "Add", "L1_A","","L1") , "AddGroup", "L1_B");
	_ObjectCallMethod( nodes , "Add", "L_A","L1");
	_ObjectCallMethod( nodes , "Add", "L_B","L1");
	_ObjectCallMethod( nodes , "Add", "L_C","L1");
|
|
156
|
How can I add multiple parents or roots
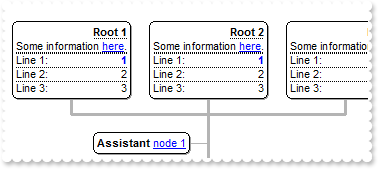
OBJECT chartview,node,nodes;

chartview =  ObjectByName("AN1") ;
_ObjectCallMethod( chartview , "BeginUpdate");
_ObjectSetProperty( chartview , "HasButtons", 3);
_ObjectSetProperty( chartview , "ButtonsAlign", 1);
_ObjectSetProperty( chartview , "PenWidthLink", 3);
_ObjectSetProperty( chartview , "IndentChild", 32);
node = _ObjectGetProperty( chartview , "Root");
	_ObjectSetProperty( node , "HasButton", 0);
	_ObjectSetProperty( node , "Caption", "<r><dotline><b>Root 1</b><br>Some information <a info>here</a>.<br><upline><dotline>Line 1:<r><fgcolor=0000FF><b>1</b></fgcolor" +
	"><br><upline><dotline>Line 2:<r>2<br><upline><dotline>Line 3:<r>3");
	_ObjectSetProperty( node , "Image", 0);
	_ObjectCallMethod( node , "AddGroup", "<r><dotline><b>Root 2</b><br>Some information <a info>here</a>.<br><upline><dotline>Line 1:<r><fgcolor=0000FF><b>1</b></fgcolor" +
	"><br><upline><dotline>Line 2:<r>2<br><upline><dotline>Line 3:<r>3");
	_ObjectCallMethod( node , "AddGroup", "<r><dotline><b>Root 3</b><br>Some information <a info>here</a>.<br><upline><dotline>Line 1:<r><fgcolor=0000FF><b>1</b></fgcolor" +
	"><br><upline><dotline>Line 2:<r>2<br><upline><dotline>Line 3:<r>3");
	_ObjectSetProperty( _ObjectCallMethod( node , "AddAssistant", "<b>Assistant</b> <a1>node 1</a>") , "Key", "A");
	node = _ObjectCallMethod( node , "AddAssistant", "<b>Assistant</b> <a2>node 2</a>");
		_ObjectSetProperty( node , "Left", -1);
		_ObjectSetProperty( node , "ShowLinks", 0);
		_ObjectSetProperty( node , "LinkTo", "A");
nodes = _ObjectGetProperty( chartview , "Nodes");
	node = _ObjectCallMethod( nodes , "Add", "Parent <b>1</b>","","Key1");
		_ObjectSetProperty( node , "HasButton", 0);
		_ObjectSetProperty( node , "ArrangeSiblingNodesAs", 2);
		_ObjectSetProperty( node , "ShowRoundLink", -1);
		_ObjectCallMethod( node , "AddGroup", "Parent <b>2</b>");
		_ObjectCallMethod( node , "AddGroup", "Parent <b>3</b>");
	_ObjectSetProperty( _ObjectCallMethod( nodes , "Add", "SubItem 1","Key1","S1") , "HasButton", 0);
	_ObjectCallMethod( nodes , "Add", "SubItem 1.1","S1","S111");
	_ObjectCallMethod( nodes , "Add", "SubItem 1.2","S1","S112");
	_ObjectCallMethod( nodes , "Add", "SubItem 2","Key1");
	_ObjectSetProperty( _ObjectCallMethod( nodes , "Add", "Item 2","","Key2") , "Expanded", 0);
	_ObjectCallMethod( nodes , "Add", "SubItem 1","Key2");
	_ObjectCallMethod( nodes , "Add", "SubItem 2","Key2");
_ObjectCallMethod( chartview , "EndUpdate");
|
|
155
|
How can I align the text/caption on the scroll bar
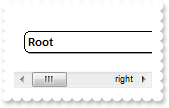
OBJECT chartview;

chartview =  ObjectByName("AN1") ;
_ObjectCallMethod(chartview, "ExecuteTemplate", "ScrollPartCaption(1,512) = `left`");
_ObjectCallMethod(chartview, "ExecuteTemplate", "ScrollPartCaptionAlignment(1,512) = 0");
_ObjectCallMethod(chartview, "ExecuteTemplate", "ScrollPartCaption(1,128) = `right`");
_ObjectCallMethod(chartview, "ExecuteTemplate", "ScrollPartCaptionAlignment(1,128) = 2");
_ObjectSetProperty( chartview , "FixedWidthNode", 320);
|
|
154
|
How can I show round links
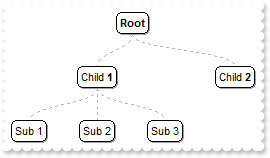
OBJECT chartview,nodes;

chartview =  ObjectByName("AN1") ;
_ObjectSetProperty( chartview , "ShowRoundLink", -1);
_ObjectSetProperty( _ObjectGetProperty( chartview , "Root") , "Image", 0);
_ObjectSetProperty( chartview , "IndentSiblingX", 32);
_ObjectSetProperty( chartview , "IndentSiblingY", 64);
nodes = _ObjectGetProperty( chartview , "Nodes");
	_ObjectSetProperty( _ObjectCallMethod( nodes , "Add", "Child <b>1</b>","","1234") , "ArrangeSiblingNodesAs", 1);
	_ObjectCallMethod( nodes , "Add", "Sub 1","1234");
	_ObjectCallMethod( nodes , "Add", "Sub 2","1234");
	_ObjectCallMethod( nodes , "Add", "Sub 3","1234");
	_ObjectCallMethod( nodes , "Add", "Child <b>2</b>");
|
|
153
|
How do I access a node by its key
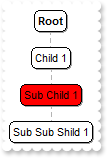
OBJECT chartview,nodes;

chartview =  ObjectByName("AN1") ;
nodes = _ObjectGetProperty( chartview , "Nodes");
	_ObjectCallMethod( nodes , "Add", "Child 1","","C1");
	_ObjectCallMethod( nodes , "Add", "Sub Child 1","C1","SC1");
	_ObjectCallMethod( nodes , "Add", "Sub Sub Shild 1","SC1");
_ObjectCallMethod(chartview, "ExecuteTemplate", "Nodes.Item(`SC1`).BackColor = 255");
|
|
152
|
How can I get the number of nodes
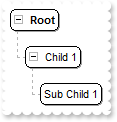
OBJECT chartview,nodes;

chartview =  ObjectByName("AN1") ;
_ObjectSetProperty( chartview , "HasButtons", -1);
_ObjectSetProperty( _ObjectGetProperty( chartview , "Root") , "ArrangeSiblingNodesAs", 2);
nodes = _ObjectGetProperty( chartview , "Nodes");
	_ObjectCallMethod( nodes , "Add", "Child 1","","C1");
	_ObjectCallMethod( nodes , "Add", "Sub Child 1","C1","SC1");
	_ObjectCallMethod( nodes , "Add", "Sub Sub Shild 1","SC1");
	_ObjectCallMethod( nodes , "Remove", 3);
|
|
151
|
How can I remove all nodes in the chart
OBJECT chartview;

chartview =  ObjectByName("AN1") ;
_ObjectCallMethod( _ObjectGetProperty( chartview , "Nodes") , "Clear");
|
|
150
|
How can I clear the chart
OBJECT chartview;

chartview =  ObjectByName("AN1") ;
_ObjectCallMethod( _ObjectGetProperty( chartview , "Nodes") , "Clear");
|
|
149
|
How can I get the number of nodes
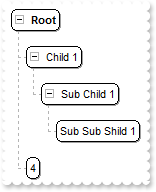
OBJECT chartview,nodes;

chartview =  ObjectByName("AN1") ;
_ObjectSetProperty( chartview , "HasButtons", -1);
_ObjectSetProperty( _ObjectGetProperty( chartview , "Root") , "ArrangeSiblingNodesAs", 2);
nodes = _ObjectGetProperty( chartview , "Nodes");
	_ObjectCallMethod( nodes , "Add", "Child 1","","C1");
	_ObjectCallMethod( nodes , "Add", "Sub Child 1","C1","SC1");
	_ObjectCallMethod( nodes , "Add", "Sub Sub Shild 1","SC1");
	_ObjectCallMethod( nodes , "Add", _ObjectGetProperty( nodes , "Count"));
|
|
148
|
How can I add a child node
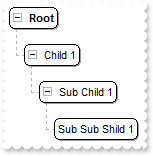
OBJECT chartview,nodes;

chartview =  ObjectByName("AN1") ;
_ObjectSetProperty( chartview , "HasButtons", -1);
_ObjectSetProperty( _ObjectGetProperty( chartview , "Root") , "ArrangeSiblingNodesAs", 2);
nodes = _ObjectGetProperty( chartview , "Nodes");
	_ObjectCallMethod( nodes , "Add", "Child 1","","C1");
	_ObjectCallMethod( nodes , "Add", "Sub Child 1","C1","SC1");
	_ObjectCallMethod( nodes , "Add", "Sub Sub Shild 1","SC1");
|
|
147
|
How can I add a child node
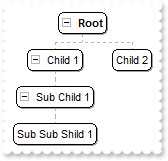
OBJECT chartview,nodes;

chartview =  ObjectByName("AN1") ;
_ObjectSetProperty( chartview , "HasButtons", -1);
nodes = _ObjectGetProperty( chartview , "Nodes");
	_ObjectCallMethod( nodes , "Add", "Child 1","","C1");
	_ObjectCallMethod( nodes , "Add", "Child 2","","C2");
	_ObjectCallMethod( nodes , "Add", "Sub Child 1","C1","SC1");
	_ObjectCallMethod( nodes , "Add", "Sub Sub Shild 1","SC1");
|
|
146
|
How can I draw link or a line between my own nodes
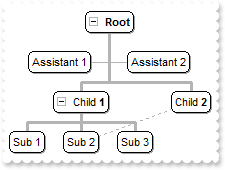
OBJECT chartview,node,nodes;

chartview =  ObjectByName("AN1") ;
_ObjectSetProperty( chartview , "HasButtons", -1);
_ObjectSetProperty( chartview , "PenLink", 0);
_ObjectSetProperty( chartview , "PenWidthLink", 3);
node = _ObjectGetProperty( chartview , "Root");
	_ObjectSetProperty( node , "Image", 0);
	_ObjectCallMethod( node , "AddAssistant", "Assistant 1");
	_ObjectCallMethod( node , "AddAssistant", "Assistant 2");
nodes = _ObjectGetProperty( chartview , "Nodes");
	_ObjectCallMethod( nodes , "Add", "Child <b>1</b>","","1234");
	_ObjectCallMethod( nodes , "Add", "Sub 1","1234");
	node = _ObjectCallMethod( nodes , "Add", "Sub 2","1234");
		_ObjectSetProperty( node , "LinkTo", "AA");
	_ObjectCallMethod( nodes , "Add", "Sub 3","1234");
	_ObjectCallMethod( nodes , "Add", "Child <b>2</b>","","AA");
|
|
145
|
How can I show or hide the link or a line between nodes
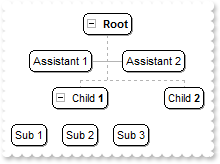
OBJECT chartview,node,nodes;

chartview =  ObjectByName("AN1") ;
_ObjectSetProperty( chartview , "HasButtons", -1);
node = _ObjectGetProperty( chartview , "Root");
	_ObjectSetProperty( node , "Image", 0);
	_ObjectCallMethod( node , "AddAssistant", "Assistant 1");
	_ObjectCallMethod( node , "AddAssistant", "Assistant 2");
nodes = _ObjectGetProperty( chartview , "Nodes");
	_ObjectSetProperty( _ObjectCallMethod( nodes , "Add", "Child <b>1</b>","","1234") , "ShowLinks", 0);
	_ObjectCallMethod( nodes , "Add", "Sub 1","1234");
	_ObjectCallMethod( nodes , "Add", "Sub 2","1234");
	_ObjectCallMethod( nodes , "Add", "Sub 3","1234");
	_ObjectCallMethod( nodes , "Add", "Child <b>2</b>");
|
|
144
|
How can I hide or show the +/- expand/collapse buttons for a specified node
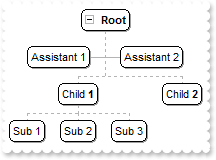
OBJECT chartview,node,nodes;

chartview =  ObjectByName("AN1") ;
_ObjectSetProperty( chartview , "HasButtons", -1);
node = _ObjectGetProperty( chartview , "Root");
	_ObjectSetProperty( node , "Image", 0);
	_ObjectCallMethod( node , "AddAssistant", "Assistant 1");
	_ObjectCallMethod( node , "AddAssistant", "Assistant 2");
nodes = _ObjectGetProperty( chartview , "Nodes");
	_ObjectSetProperty( _ObjectCallMethod( nodes , "Add", "Child <b>1</b>","","1234") , "HasButton", 0);
	_ObjectCallMethod( nodes , "Add", "Sub 1","1234");
	_ObjectCallMethod( nodes , "Add", "Sub 2","1234");
	_ObjectCallMethod( nodes , "Add", "Sub 3","1234");
	_ObjectCallMethod( nodes , "Add", "Child <b>2</b>");
|
|
143
|
How can I expand or collapse a node
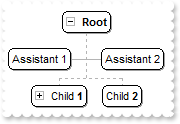
OBJECT chartview,node,nodes;

chartview =  ObjectByName("AN1") ;
_ObjectSetProperty( chartview , "HasButtons", -1);
node = _ObjectGetProperty( chartview , "Root");
	_ObjectSetProperty( node , "Image", 0);
	_ObjectCallMethod( node , "AddAssistant", "Assistant 1");
	_ObjectCallMethod( node , "AddAssistant", "Assistant 2");
nodes = _ObjectGetProperty( chartview , "Nodes");
	_ObjectSetProperty( _ObjectCallMethod( nodes , "Add", "Child <b>1</b>","","1234") , "Expanded", 0);
	_ObjectCallMethod( nodes , "Add", "Sub 1","1234");
	_ObjectCallMethod( nodes , "Add", "Sub 2","1234");
	_ObjectCallMethod( nodes , "Add", "Sub 3","1234");
	_ObjectCallMethod( nodes , "Add", "Child <b>2</b>");
|
|
142
|
How can I assign an icon to the root node

OBJECT chartview;

chartview =  ObjectByName("AN1") ;
_ObjectCallMethod( chartview , "Images", "gBJJgBAIDAAGAAEAAQhYAf8Pf4hh0QihCJo2AEZjQAjEZFEaIEaEEaAIAkcbk0olUrlktl0vmExmUzmk1m03nE5nU7nk9n0/oFBoVDolFo1HpFJpVLplNp1PqFRqVTq" +
	"lVq1XrFZrVbrldr1fsFhsVjslls1ntFptVrtltt1vuFxuVzul1u13vF5vV7vl9v1/wGBwWDwmFw2HxGJxWLxmNx0xiFdyOTh8Tf9ZymXx+QytcyNgz8r0OblWjyWds+m" +
	"0ka1Vf1ta1+r1mos2xrG2xeZ0+a0W0qOx3GO4NV3WeyvD2XJ5XL5nN51aiw+lfSj0gkUkAEllHanHI5j/cHg8EZf7w8vl8j4f/qfEZeB09/vjLAB30+kZQAP/P5/H6/y" +
	"NAOAEAwCjMBwFAEDwJBMDwLBYAP2/8Hv8/gAGAD8LQs9w/nhDY/oygIA=");
_ObjectSetProperty( _ObjectGetProperty( chartview , "Root") , "Image", 1);
|
|
141
|
How can I access an assistant nodes
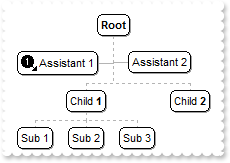
OBJECT chartview,node,nodes;

chartview =  ObjectByName("AN1") ;
_ObjectCallMethod( chartview , "BeginUpdate");
_ObjectCallMethod( chartview , "Images", "gBJJgBAIDAAGAAEAAQhYAf8Pf4hh0QihCJo2AEZjQAjEZFEaIEaEEaAIAkcbk0olUrlktl0vmExmUzmk1m03nE5nU7nk9n0/oFBoVDolFo1HpFJpVLplNp1PqFRqVTq" +
	"lVq1XrFZrVbrldr1fsFhsVjslls1ntFptVrtltt1vuFxuVzul1u13vF5vV7vl9v1/wGBwWDwmFw2HxGJxWLxmNx0xiFdyOTh8Tf9ZymXx+QytcyNgz8r0OblWjyWds+m" +
	"0ka1Vf1ta1+r1mos2xrG2xeZ0+a0W0qOx3GO4NV3WeyvD2XJ5XL5nN51aiw+lfSj0gkUkAEllHanHI5j/cHg8EZf7w8vl8j4f/qfEZeB09/vjLAB30+kZQAP/P5/H6/y" +
	"NAOAEAwCjMBwFAEDwJBMDwLBYAP2/8Hv8/gAGAD8LQs9w/nhDY/oygIA=");
node = _ObjectGetProperty( chartview , "Root");
	_ObjectSetProperty( node , "Image", 0);
	_ObjectCallMethod( node , "AddAssistant", "Assistant 1");
	_ObjectCallMethod( node , "AddAssistant", "Assistant 2");
	_ObjectCallMethod(chartview, "TemplatePut", "Dim nodObj")
	_ObjectCallMethod(chartview, "TemplatePut", node)
	_ObjectCallMethod(chartview, "ExecuteTemplate", "nodObj.Assistant(0).Image = 1");
nodes = _ObjectGetProperty( chartview , "Nodes");
	_ObjectCallMethod( nodes , "Add", "Child <b>1</b>","","1234");
	_ObjectCallMethod( nodes , "Add", "Sub 1","1234");
	_ObjectCallMethod( nodes , "Add", "Sub 2","1234");
	_ObjectCallMethod( nodes , "Add", "Sub 3","1234");
	_ObjectCallMethod( nodes , "Add", "Child <b>2</b>");
_ObjectCallMethod( chartview , "EndUpdate");
|
|
140
|
How can I get the number or count of assistant nodes
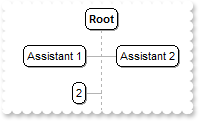
OBJECT chartview,node,nodes;

chartview =  ObjectByName("AN1") ;
_ObjectCallMethod( chartview , "BeginUpdate");
node = _ObjectGetProperty( chartview , "Root");
	_ObjectSetProperty( node , "Image", 0);
	_ObjectCallMethod( node , "AddAssistant", "Assistant 1");
	_ObjectCallMethod( node , "AddAssistant", "Assistant 2");
	_ObjectCallMethod( node , "AddAssistant", _ObjectGetProperty( node , "CountAssistants"));
nodes = _ObjectGetProperty( chartview , "Nodes");
	_ObjectCallMethod( nodes , "Add", "Child <b>1</b>","","1234");
	_ObjectCallMethod( nodes , "Add", "Sub 1","1234");
	_ObjectCallMethod( nodes , "Add", "Sub 2","1234");
	_ObjectCallMethod( nodes , "Add", "Sub 3","1234");
	_ObjectCallMethod( nodes , "Add", "Child <b>2</b>");
_ObjectCallMethod( chartview , "EndUpdate");
|
|
139
|
How can I display assistant nodes on the right side only
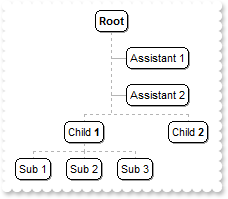
OBJECT chartview,node,nodes;

chartview =  ObjectByName("AN1") ;
_ObjectCallMethod( chartview , "BeginUpdate");
node = _ObjectGetProperty( chartview , "Root");
	_ObjectSetProperty( node , "Image", 0);
	_ObjectSetProperty( _ObjectCallMethod( node , "AddAssistant", "Assistant 1") , "Left", 0);
	_ObjectSetProperty( _ObjectCallMethod( node , "AddAssistant", "Assistant 2") , "Left", 0);
nodes = _ObjectGetProperty( chartview , "Nodes");
	_ObjectCallMethod( nodes , "Add", "Child <b>1</b>","","1234");
	_ObjectCallMethod( nodes , "Add", "Sub 1","1234");
	_ObjectCallMethod( nodes , "Add", "Sub 2","1234");
	_ObjectCallMethod( nodes , "Add", "Sub 3","1234");
	_ObjectCallMethod( nodes , "Add", "Child <b>2</b>");
_ObjectCallMethod( chartview , "EndUpdate");
|
|
138
|
How can I display assistant nodes on the left side only
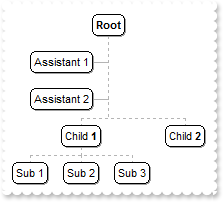
OBJECT chartview,node,nodes;

chartview =  ObjectByName("AN1") ;
_ObjectCallMethod( chartview , "BeginUpdate");
node = _ObjectGetProperty( chartview , "Root");
	_ObjectSetProperty( node , "Image", 0);
	_ObjectSetProperty( _ObjectCallMethod( node , "AddAssistant", "Assistant 1") , "Left", -1);
	_ObjectSetProperty( _ObjectCallMethod( node , "AddAssistant", "Assistant 2") , "Left", -1);
nodes = _ObjectGetProperty( chartview , "Nodes");
	_ObjectCallMethod( nodes , "Add", "Child <b>1</b>","","1234");
	_ObjectCallMethod( nodes , "Add", "Sub 1","1234");
	_ObjectCallMethod( nodes , "Add", "Sub 2","1234");
	_ObjectCallMethod( nodes , "Add", "Sub 3","1234");
	_ObjectCallMethod( nodes , "Add", "Child <b>2</b>");
_ObjectCallMethod( chartview , "EndUpdate");
|
|
137
|
How can I clear or remove all assistant nodes
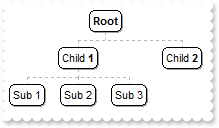
OBJECT chartview,node,nodes;

chartview =  ObjectByName("AN1") ;
_ObjectCallMethod( chartview , "BeginUpdate");
node = _ObjectGetProperty( chartview , "Root");
	_ObjectSetProperty( node , "Image", 0);
	_ObjectCallMethod( node , "AddAssistant", "Assistant 1");
	_ObjectCallMethod( node , "AddAssistant", "Assistant 2");
	_ObjectCallMethod( node , "ClearAssistants");
nodes = _ObjectGetProperty( chartview , "Nodes");
	_ObjectCallMethod( nodes , "Add", "Child <b>1</b>","","1234");
	_ObjectCallMethod( nodes , "Add", "Sub 1","1234");
	_ObjectCallMethod( nodes , "Add", "Sub 2","1234");
	_ObjectCallMethod( nodes , "Add", "Sub 3","1234");
	_ObjectCallMethod( nodes , "Add", "Child <b>2</b>");
_ObjectCallMethod( chartview , "EndUpdate");
|
|
136
|
How can I remove an assistant node
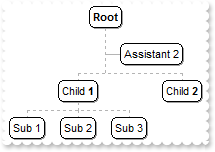
OBJECT chartview,node,nodes;

chartview =  ObjectByName("AN1") ;
node = _ObjectGetProperty( chartview , "Root");
	_ObjectSetProperty( node , "Image", 0);
	_ObjectCallMethod( node , "AddAssistant", "Assistant 1");
	_ObjectCallMethod( node , "AddAssistant", "Assistant 2");
	_ObjectCallMethod( node , "RemoveAssistant", 0);
nodes = _ObjectGetProperty( chartview , "Nodes");
	_ObjectCallMethod( nodes , "Add", "Child <b>1</b>","","1234");
	_ObjectCallMethod( nodes , "Add", "Sub 1","1234");
	_ObjectCallMethod( nodes , "Add", "Sub 2","1234");
	_ObjectCallMethod( nodes , "Add", "Sub 3","1234");
	_ObjectCallMethod( nodes , "Add", "Child <b>2</b>");
|
|
135
|
How can I add assistant node
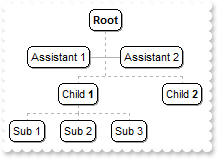
OBJECT chartview,node,nodes;

chartview =  ObjectByName("AN1") ;
node = _ObjectGetProperty( chartview , "Root");
	_ObjectSetProperty( node , "Image", 0);
	_ObjectCallMethod( node , "AddAssistant", "Assistant 1");
	_ObjectCallMethod( node , "AddAssistant", "Assistant 2");
nodes = _ObjectGetProperty( chartview , "Nodes");
	_ObjectCallMethod( nodes , "Add", "Child <b>1</b>","","1234");
	_ObjectCallMethod( nodes , "Add", "Sub 1","1234");
	_ObjectCallMethod( nodes , "Add", "Sub 2","1234");
	_ObjectCallMethod( nodes , "Add", "Sub 3","1234");
	_ObjectCallMethod( nodes , "Add", "Child <b>2</b>");
|
|
134
|
Can I change the border's node, using your EBN technology
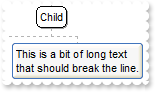
OBJECT chartview,node,nodes;

chartview =  ObjectByName("AN1") ;
_ObjectCallMethod( _ObjectGetProperty( chartview , "VisualAppearance") , "Add", 1,"c:\exontrol\images\hot.ebn");
nodes = _ObjectGetProperty( chartview , "Nodes");
	_ObjectCallMethod( nodes , "Add", "Child","","1234");
	_ObjectCallMethod( nodes , "Add", "Sub 1","1234");
	node = _ObjectCallMethod( nodes , "Add", "Sub 2","1234");
		_ObjectSetProperty( node , "Caption", "This is a bit of long text that should break the line.");
		_ObjectSetProperty( node , "BackColor", 16777216);
|
|
133
|
Can I remove the shadow for a specified node
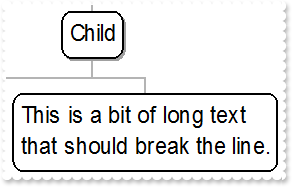
OBJECT chartview,node,nodes;

chartview =  ObjectByName("AN1") ;
nodes = _ObjectGetProperty( chartview , "Nodes");
	_ObjectCallMethod( nodes , "Add", "Child","","1234");
	_ObjectCallMethod( nodes , "Add", "Sub 1","1234");
	node = _ObjectCallMethod( nodes , "Add", "Sub 2","1234");
		_ObjectSetProperty( node , "Caption", "This is a bit of long text that should break the line.");
		_ObjectSetProperty( node , "ShadowNode", 0);
|
|
132
|
Can I change the border for a specified node
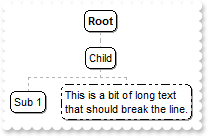
OBJECT chartview,node,nodes;

chartview =  ObjectByName("AN1") ;
nodes = _ObjectGetProperty( chartview , "Nodes");
	_ObjectCallMethod( nodes , "Add", "Child","","1234");
	_ObjectCallMethod( nodes , "Add", "Sub 1","1234");
	node = _ObjectCallMethod( nodes , "Add", "Sub 2","1234");
		_ObjectSetProperty( node , "Caption", "This is a bit of long text that should break the line.");
		_ObjectSetProperty( node , "PenBorderNode", 4);
|
|
131
|
Can I remove the round corner for a specified node
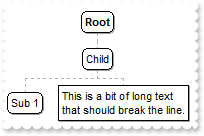
OBJECT chartview,node,nodes;

chartview =  ObjectByName("AN1") ;
nodes = _ObjectGetProperty( chartview , "Nodes");
	_ObjectCallMethod( nodes , "Add", "Child","","1234");
	_ObjectCallMethod( nodes , "Add", "Sub 1","1234");
	node = _ObjectCallMethod( nodes , "Add", "Sub 2","1234");
		_ObjectSetProperty( node , "Caption", "This is a bit of long text that should break the line.");
		_ObjectSetProperty( node , "DrawRoundNode", 0);
|
|
130
|
How can I disable or enable a node
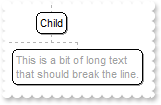
OBJECT chartview,node,nodes;

chartview =  ObjectByName("AN1") ;
nodes = _ObjectGetProperty( chartview , "Nodes");
	_ObjectCallMethod( nodes , "Add", "Child","","1234");
	_ObjectCallMethod( nodes , "Add", "Sub 1","1234");
	node = _ObjectCallMethod( nodes , "Add", "Sub 2","1234");
		_ObjectSetProperty( node , "Caption", "This is a bit of long text that should break the line.");
		_ObjectSetProperty( node , "Enabled", 0);
|
|
129
|
How can I specify the height of the node
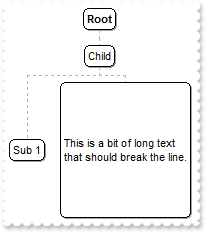
OBJECT chartview,node,nodes;

chartview =  ObjectByName("AN1") ;
nodes = _ObjectGetProperty( chartview , "Nodes");
	_ObjectCallMethod( nodes , "Add", "Child","","1234");
	_ObjectCallMethod( nodes , "Add", "Sub 1","1234");
	node = _ObjectCallMethod( nodes , "Add", "Sub 2","1234");
		_ObjectSetProperty( node , "Caption", "This is a bit of long text that should break the line.");
		_ObjectSetProperty( node , "FixedHeight", 128);
|
|
128
|
How can I specify the width of the node
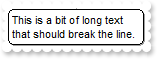
OBJECT chartview,node,nodes;

chartview =  ObjectByName("AN1") ;
nodes = _ObjectGetProperty( chartview , "Nodes");
	_ObjectCallMethod( nodes , "Add", "Child","","1234");
	_ObjectCallMethod( nodes , "Add", "Sub 1","1234");
	node = _ObjectCallMethod( nodes , "Add", "Sub 2","1234");
		_ObjectSetProperty( node , "Caption", "This is a bit of long text that should break the line.");
		_ObjectSetProperty( node , "FixedWidth", 128);
|
|
127
|
How can I specify the width of the node to wrap it's content
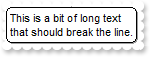
OBJECT chartview,node,nodes;

chartview =  ObjectByName("AN1") ;
nodes = _ObjectGetProperty( chartview , "Nodes");
	_ObjectCallMethod( nodes , "Add", "Child","","1234");
	_ObjectCallMethod( nodes , "Add", "Sub 1","1234");
	node = _ObjectCallMethod( nodes , "Add", "Sub 2","1234");
		_ObjectSetProperty( node , "Caption", "This is a bit of long text that should break the line.");
		_ObjectSetProperty( node , "Width", 128);
|
|
126
|
How can I change the position of the node
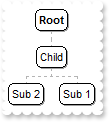
OBJECT chartview,nodes;

chartview =  ObjectByName("AN1") ;
nodes = _ObjectGetProperty( chartview , "Nodes");
	_ObjectCallMethod( nodes , "Add", "Child","","1234");
	_ObjectCallMethod( nodes , "Add", "Sub 1","1234");
	_ObjectSetProperty( _ObjectCallMethod( nodes , "Add", "Sub 2","1234") , "Position", 0);
|
|
125
|
How can I count or get the number of child nodes
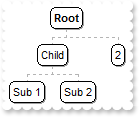
OBJECT chartview,nodes;

chartview =  ObjectByName("AN1") ;
nodes = _ObjectGetProperty( chartview , "Nodes");
	_ObjectCallMethod( nodes , "Add", "Child","","1234");
	_ObjectCallMethod( nodes , "Add", "Sub 1","1234");
	_ObjectCallMethod( nodes , "Add", "Sub 2","1234");
	_ObjectCallMethod(chartview, "TemplatePut", "Dim nodObj")
	_ObjectCallMethod(chartview, "TemplatePut", nodes)
	_ObjectCallMethod( nodes , "Add", _ObjectCallMethod(chartview, "ExecuteTemplate", "nodObj.Item(`1234`).NodeCount"));
|
|
124
|
How can I enumerate the child nodes
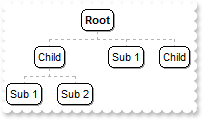
OBJECT chartview,nodes;

chartview =  ObjectByName("AN1") ;
nodes = _ObjectGetProperty( chartview , "Nodes");
	_ObjectCallMethod( nodes , "Add", "Child","","1234");
	_ObjectCallMethod( nodes , "Add", "Sub 1","1234");
	_ObjectCallMethod( nodes , "Add", "Sub 2","1234");
	_ObjectCallMethod(chartview, "TemplatePut", "Dim nodObj")
	_ObjectCallMethod(chartview, "TemplatePut", nodes)
	_ObjectCallMethod( nodes , "Add", _ObjectCallMethod(chartview, "ExecuteTemplate", "nodObj.Item(`1234`).FirstNode.Caption"));
	_ObjectCallMethod( nodes , "Add", _ObjectCallMethod(chartview, "ExecuteTemplate", "nodObj.Item(`1234`).FirstNode.NextNode.Caption"));
|
|
123
|
How can I change the node's parent
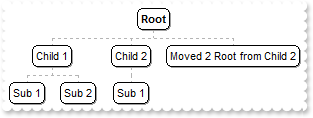
OBJECT chartview,node;

chartview =  ObjectByName("AN1") ;
_ObjectCallMethod( chartview , "BeginUpdate");
_ObjectCallMethod( _ObjectGetProperty( chartview , "Nodes") , "Add", "Child 1","","1234");
_ObjectCallMethod( _ObjectGetProperty( chartview , "Nodes") , "Add", "Sub 1","1234");
_ObjectCallMethod( _ObjectGetProperty( chartview , "Nodes") , "Add", "Sub 2","1234");
_ObjectCallMethod( _ObjectGetProperty( chartview , "Nodes") , "Add", "Child 2","","1235");
_ObjectCallMethod( _ObjectGetProperty( chartview , "Nodes") , "Add", "Sub 1","1235");
_ObjectCallMethod( _ObjectGetProperty( chartview , "Nodes") , "Add", "To Move","1235","Move");
node = _ObjectCallMethod(chartview, "ExecuteTemplate", "Nodes.Item(`Move`)");
	_ObjectSetProperty( node , "Parent", _ObjectGetProperty( chartview , "Root"));
	_ObjectSetProperty( node , "Caption", "Moved 2 Root from Child 2");
_ObjectCallMethod( chartview , "EndUpdate");
|
|
122
|
How can I assign a key to a node
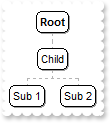
OBJECT chartview;

chartview =  ObjectByName("AN1") ;
_ObjectCallMethod( _ObjectGetProperty( chartview , "Nodes") , "Add", "Child","","1234");
_ObjectCallMethod( _ObjectGetProperty( chartview , "Nodes") , "Add", "Sub 1","1234");
_ObjectCallMethod( _ObjectGetProperty( chartview , "Nodes") , "Add", "Sub 2","1234");
|
|
121
|
How can I assign a key to a node
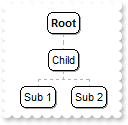
OBJECT chartview;

chartview =  ObjectByName("AN1") ;
_ObjectSetProperty( _ObjectCallMethod( _ObjectGetProperty( chartview , "Nodes") , "Add", "Child") , "Key", "1234");
_ObjectCallMethod( _ObjectGetProperty( chartview , "Nodes") , "Add", "Sub 1","1234");
_ObjectCallMethod( _ObjectGetProperty( chartview , "Nodes") , "Add", "Sub 2","1234");
|
|
120
|
How can I change the node's background color

OBJECT chartview,node;

chartview =  ObjectByName("AN1") ;
node = _ObjectCallMethod( _ObjectGetProperty( chartview , "Nodes") , "Add", "Child");
	_ObjectSetProperty( node , "BackColor", 255);
	_ObjectCallMethod( node , "ClearBackColor");
|
|
119
|
How can I change the node's background color

OBJECT chartview;

chartview =  ObjectByName("AN1") ;
_ObjectSetProperty( _ObjectCallMethod( _ObjectGetProperty( chartview , "Nodes") , "Add", "Child") , "BackColor", 255);
|
|
118
|
How can I change the node's foreground color

OBJECT chartview,node;

chartview =  ObjectByName("AN1") ;
node = _ObjectCallMethod( _ObjectGetProperty( chartview , "Nodes") , "Add", "Child");
	_ObjectSetProperty( node , "ForeColor", 255);
	_ObjectCallMethod( node , "ClearForeColor");
|
|
117
|
How can I change the node's foreground color

OBJECT chartview;

chartview =  ObjectByName("AN1") ;
_ObjectSetProperty( _ObjectCallMethod( _ObjectGetProperty( chartview , "Nodes") , "Add", "Child") , "ForeColor", 255);
|
|
116
|
How can I assign a tooltip to a node
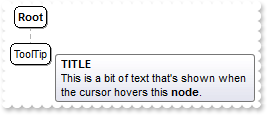
OBJECT chartview,node;

chartview =  ObjectByName("AN1") ;
node = _ObjectCallMethod( _ObjectGetProperty( chartview , "Nodes") , "Add", "ToolTip");
	_ObjectSetProperty( node , "ToolTip", "This is a bit of text that's shown when the cursor hovers this <b>node</b>.");
	_ObjectSetProperty( node , "ToolTipTitle", "TITLE");
|
|
115
|
How can I assign a different font for the node's tooltip
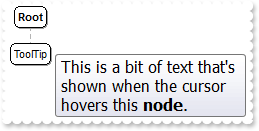
OBJECT chartview;

chartview =  ObjectByName("AN1") ;
_ObjectSetProperty( _ObjectCallMethod( _ObjectGetProperty( chartview , "Nodes") , "Add", "ToolTip") , "ToolTip", "<font Tahoma;12>This is a bit of text that's shown when the cursor hovers this <b>node</b>.</font>");
|
|
114
|
How can I assign a tooltip to a node
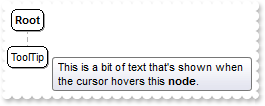
OBJECT chartview;

chartview =  ObjectByName("AN1") ;
_ObjectSetProperty( _ObjectCallMethod( _ObjectGetProperty( chartview , "Nodes") , "Add", "ToolTip") , "ToolTip", "This is a bit of text that's shown when the cursor hovers this <b>node</b>.");
|
|
113
|
How can I assign any extra data to my node

OBJECT chartview;

chartview =  ObjectByName("AN1") ;
_ObjectSetProperty( _ObjectCallMethod( _ObjectGetProperty( chartview , "Nodes") , "Add", "Child") , "UserData", "your data");
|
|
112
|
How can I assign an icon and a picture to a node
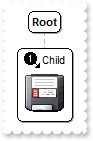
OBJECT chartview,node;

chartview =  ObjectByName("AN1") ;
_ObjectCallMethod( chartview , "Images", "gBJJgBAIDAAGAAEAAQhYAf8Pf4hh0QihCJo2AEZjQAjEZFEaIEaEEaAIAkcbk0olUrlktl0vmExmUzmk1m03nE5nU7nk9n0/oFBoVDolFo1HpFJpVLplNp1PqFRqVTq" +
	"lVq1XrFZrVbrldr1fsFhsVjslls1ntFptVrtltt1vuFxuVzul1u13vF5vV7vl9v1/wGBwWDwmFw2HxGJxWLxmNx0xiFdyOTh8Tf9ZymXx+QytcyNgz8r0OblWjyWds+m" +
	"0ka1Vf1ta1+r1mos2xrG2xeZ0+a0W0qOx3GO4NV3WeyvD2XJ5XL5nN51aiw+lfSj0gkUkAEllHanHI5j/cHg8EZf7w8vl8j4f/qfEZeB09/vjLAB30+kZQAP/P5/H6/y" +
	"NAOAEAwCjMBwFAEDwJBMDwLBYAP2/8Hv8/gAGAD8LQs9w/nhDY/oygIA=");
node = _ObjectCallMethod( _ObjectGetProperty( chartview , "Nodes") , "Add", "Child");
	_ObjectSetProperty( node , "Image", 1);
	_ObjectSetProperty( node , "Picture", _ObjectCallMethod( chartview , "ExecuteTemplate", "loadpicture(`c:\exontrol\images\zipdisk.gif`)"));
	_ObjectSetProperty( node , "PictureAlignment", 3);
|
|
111
|
How can I align the picture in the node
OBJECT chartview,node;

chartview =  ObjectByName("AN1") ;
node = _ObjectCallMethod( _ObjectGetProperty( chartview , "Nodes") , "Add", "Child");
	_ObjectSetProperty( node , "Picture", _ObjectCallMethod( chartview , "ExecuteTemplate", "loadpicture(`c:\exontrol\images\zipdisk.gif`)"));
	_ObjectSetProperty( node , "PictureAlignment", 3);
|
|
110
|
How can I align the picture in the node
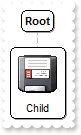
OBJECT chartview,node;

chartview =  ObjectByName("AN1") ;
node = _ObjectCallMethod( _ObjectGetProperty( chartview , "Nodes") , "Add", "Child");
	_ObjectSetProperty( node , "Picture", _ObjectCallMethod( chartview , "ExecuteTemplate", "loadpicture(`c:\exontrol\images\zipdisk.gif`)"));
	_ObjectSetProperty( node , "PictureAlignment", 2);
|
|
109
|
How can I align the picture in the node
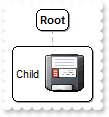
OBJECT chartview,node;

chartview =  ObjectByName("AN1") ;
node = _ObjectCallMethod( _ObjectGetProperty( chartview , "Nodes") , "Add", "Child");
	_ObjectSetProperty( node , "Picture", _ObjectCallMethod( chartview , "ExecuteTemplate", "loadpicture(`c:\exontrol\images\zipdisk.gif`)"));
	_ObjectSetProperty( node , "PictureAlignment", 1);
|
|
108
|
How can I assign a picture to a node
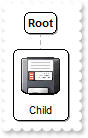
OBJECT chartview;

chartview =  ObjectByName("AN1") ;
_ObjectSetProperty( _ObjectCallMethod( _ObjectGetProperty( chartview , "Nodes") , "Add", "Child") , "Picture", _ObjectCallMethod( chartview , "ExecuteTemplate", "loadpicture(`c:\exontrol\images\zipdisk.gif`)"));
|
|
107
|
How can I align the icon in the node
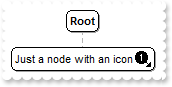
OBJECT chartview,node;

chartview =  ObjectByName("AN1") ;
_ObjectCallMethod( chartview , "Images", "gBJJgBAIDAAGAAEAAQhYAf8Pf4hh0QihCJo2AEZjQAjEZFEaIEaEEaAIAkcbk0olUrlktl0vmExmUzmk1m03nE5nU7nk9n0/oFBoVDolFo1HpFJpVLplNp1PqFRqVTq" +
	"lVq1XrFZrVbrldr1fsFhsVjslls1ntFptVrtltt1vuFxuVzul1u13vF5vV7vl9v1/wGBwWDwmFw2HxGJxWLxmNx0xiFdyOTh8Tf9ZymXx+QytcyNgz8r0OblWjyWds+m" +
	"0ka1Vf1ta1+r1mos2xrG2xeZ0+a0W0qOx3GO4NV3WeyvD2XJ5XL5nN51aiw+lfSj0gkUkAEllHanHI5j/cHg8EZf7w8vl8j4f/qfEZeB09/vjLAB30+kZQAP/P5/H6/y" +
	"NAOAEAwCjMBwFAEDwJBMDwLBYAP2/8Hv8/gAGAD8LQs9w/nhDY/oygIA=");
node = _ObjectCallMethod( _ObjectGetProperty( chartview , "Nodes") , "Add", "Just a node with an icon");
	_ObjectSetProperty( node , "Image", 1);
	_ObjectSetProperty( node , "ImageAlignment", 1);
|
|
106
|
How can I align the icon in the node
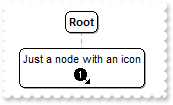
OBJECT chartview,node;

chartview =  ObjectByName("AN1") ;
_ObjectCallMethod( chartview , "Images", "gBJJgBAIDAAGAAEAAQhYAf8Pf4hh0QihCJo2AEZjQAjEZFEaIEaEEaAIAkcbk0olUrlktl0vmExmUzmk1m03nE5nU7nk9n0/oFBoVDolFo1HpFJpVLplNp1PqFRqVTq" +
	"lVq1XrFZrVbrldr1fsFhsVjslls1ntFptVrtltt1vuFxuVzul1u13vF5vV7vl9v1/wGBwWDwmFw2HxGJxWLxmNx0xiFdyOTh8Tf9ZymXx+QytcyNgz8r0OblWjyWds+m" +
	"0ka1Vf1ta1+r1mos2xrG2xeZ0+a0W0qOx3GO4NV3WeyvD2XJ5XL5nN51aiw+lfSj0gkUkAEllHanHI5j/cHg8EZf7w8vl8j4f/qfEZeB09/vjLAB30+kZQAP/P5/H6/y" +
	"NAOAEAwCjMBwFAEDwJBMDwLBYAP2/8Hv8/gAGAD8LQs9w/nhDY/oygIA=");
node = _ObjectCallMethod( _ObjectGetProperty( chartview , "Nodes") , "Add", "Just a node with an icon");
	_ObjectSetProperty( node , "Image", 1);
	_ObjectSetProperty( node , "ImageAlignment", 3);
|
|
105
|
How can I align the icon in the node
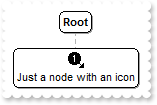
OBJECT chartview,node;

chartview =  ObjectByName("AN1") ;
_ObjectCallMethod( chartview , "Images", "gBJJgBAIDAAGAAEAAQhYAf8Pf4hh0QihCJo2AEZjQAjEZFEaIEaEEaAIAkcbk0olUrlktl0vmExmUzmk1m03nE5nU7nk9n0/oFBoVDolFo1HpFJpVLplNp1PqFRqVTq" +
	"lVq1XrFZrVbrldr1fsFhsVjslls1ntFptVrtltt1vuFxuVzul1u13vF5vV7vl9v1/wGBwWDwmFw2HxGJxWLxmNx0xiFdyOTh8Tf9ZymXx+QytcyNgz8r0OblWjyWds+m" +
	"0ka1Vf1ta1+r1mos2xrG2xeZ0+a0W0qOx3GO4NV3WeyvD2XJ5XL5nN51aiw+lfSj0gkUkAEllHanHI5j/cHg8EZf7w8vl8j4f/qfEZeB09/vjLAB30+kZQAP/P5/H6/y" +
	"NAOAEAwCjMBwFAEDwJBMDwLBYAP2/8Hv8/gAGAD8LQs9w/nhDY/oygIA=");
node = _ObjectCallMethod( _ObjectGetProperty( chartview , "Nodes") , "Add", "Just a node with an icon");
	_ObjectSetProperty( node , "Image", 1);
	_ObjectSetProperty( node , "ImageAlignment", 2);
|
|
104
|
How can I assign an icon to a node

OBJECT chartview;

chartview =  ObjectByName("AN1") ;
_ObjectCallMethod( chartview , "Images", "gBJJgBAIDAAGAAEAAQhYAf8Pf4hh0QihCJo2AEZjQAjEZFEaIEaEEaAIAkcbk0olUrlktl0vmExmUzmk1m03nE5nU7nk9n0/oFBoVDolFo1HpFJpVLplNp1PqFRqVTq" +
	"lVq1XrFZrVbrldr1fsFhsVjslls1ntFptVrtltt1vuFxuVzul1u13vF5vV7vl9v1/wGBwWDwmFw2HxGJxWLxmNx0xiFdyOTh8Tf9ZymXx+QytcyNgz8r0OblWjyWds+m" +
	"0ka1Vf1ta1+r1mos2xrG2xeZ0+a0W0qOx3GO4NV3WeyvD2XJ5XL5nN51aiw+lfSj0gkUkAEllHanHI5j/cHg8EZf7w8vl8j4f/qfEZeB09/vjLAB30+kZQAP/P5/H6/y" +
	"NAOAEAwCjMBwFAEDwJBMDwLBYAP2/8Hv8/gAGAD8LQs9w/nhDY/oygIA=");
_ObjectSetProperty( _ObjectCallMethod( _ObjectGetProperty( chartview , "Nodes") , "Add", "Child") , "Image", 1);
|
|
103
|
How can I change the font for a node
OBJECT chartview;

chartview =  ObjectByName("AN1") ;
_ObjectSetProperty( _ObjectCallMethod( _ObjectGetProperty( chartview , "Nodes") , "Add", "Child") , "Caption", "<font Tahoma;12>new</font> caption");
|
|
102
|
How can I add a multiple lines node
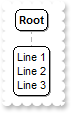
OBJECT chartview;

chartview =  ObjectByName("AN1") ;
_ObjectSetProperty( _ObjectCallMethod( _ObjectGetProperty( chartview , "Nodes") , "Add", "") , "Caption", "Line 1<br>Line 2<br>Line3");
|
|
101
|
How can I add a multiple lines node
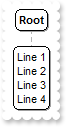
OBJECT chartview;

chartview =  ObjectByName("AN1") ;
_ObjectCallMethod( _ObjectGetProperty( chartview , "Nodes") , "Add", "Line 1<br>Line 2<br>Line3");
|