|
1019
|
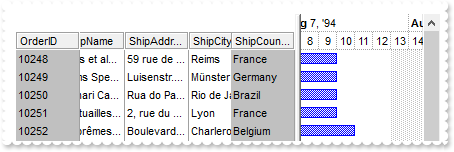
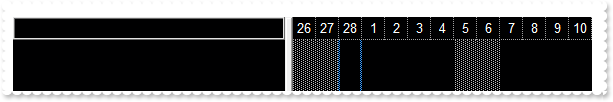
Locks the first visible column on the left and the last visible column on the right
*** AddItem event - Occurs after a new Item has been inserted to Items collection. ***
LPARAMETERS Item
	with thisform.Gantt1
		with .Items
			.AddBar(Item,"Task",.CellCaption(Item,1),.CellCaption(Item,2))
		endwith
	endwith

with thisform.Gantt1
	.BeginUpdate
	with .Chart
		.FirstVisibleDate = {^1994-8-8}
		.LevelCount = 2
	endwith
	.ColumnAutoResize = .F.
	.BackColorLock = RGB(192,192,192)
	.GridLineStyle = 48
	.DrawGridLines = 2
	.HeaderAppearance = 4
	rs = CreateObject("ADOR.Recordset")
	with rs
		.Open("Orders","Provider=Microsoft.ACE.OLEDB.12.0;Data Source=C:\Program Files\Exontrol\ExGantt\Sample\Access\sample.mdb",3,3)
	endwith
	.DataSource = rs
	.CountLockedColumns = 17
	.EndUpdate
endwith
|
|
1018
|
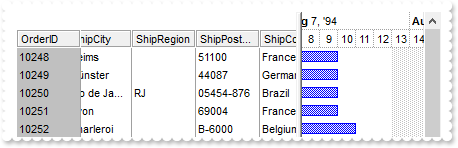
Lock the column on the right
*** AddItem event - Occurs after a new Item has been inserted to Items collection. ***
LPARAMETERS Item
	with thisform.Gantt1
		with .Items
			.AddBar(Item,"Task",.CellCaption(Item,1),.CellCaption(Item,2))
		endwith
	endwith

with thisform.Gantt1
	.BeginUpdate
	with .Chart
		.FirstVisibleDate = {^1994-8-8}
		.LevelCount = 2
	endwith
	.ColumnAutoResize = .F.
	.BackColorLock = RGB(192,192,192)
	.GridLineStyle = 48
	.DrawGridLines = 2
	.HeaderAppearance = 4
	rs = CreateObject("ADOR.Recordset")
	with rs
		.Open("Orders","Provider=Microsoft.ACE.OLEDB.12.0;Data Source=C:\Program Files\Exontrol\ExGantt\Sample\Access\sample.mdb",3,3)
	endwith
	.DataSource = rs
	.CountLockedColumns = 16
	.EndUpdate
endwith
|
|
1017
|
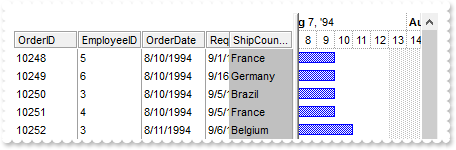
Lock the column on the left
*** AddItem event - Occurs after a new Item has been inserted to Items collection. ***
LPARAMETERS Item
	with thisform.Gantt1
		with .Items
			.AddBar(Item,"Task",.CellCaption(Item,1),.CellCaption(Item,2))
		endwith
	endwith

with thisform.Gantt1
	.BeginUpdate
	with .Chart
		.FirstVisibleDate = {^1994-8-8}
		.LevelCount = 2
	endwith
	.ColumnAutoResize = .F.
	.BackColorLock = RGB(192,192,192)
	.GridLineStyle = 48
	.DrawGridLines = 2
	.HeaderAppearance = 4
	rs = CreateObject("ADOR.Recordset")
	with rs
		.Open("Orders","Provider=Microsoft.ACE.OLEDB.12.0;Data Source=C:\Program Files\Exontrol\ExGantt\Sample\Access\sample.mdb",3,3)
	endwith
	.DataSource = rs
	.CountLockedColumns = 1
	.EndUpdate
endwith
|
|
1016
|
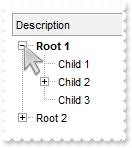
Bolds only the expanded items
with thisform.Gantt1
	.BeginUpdate
	.HeaderAppearance = 4
	.HeaderHeight = 24
	.LinesAtRoot = -1
	.ConditionalFormats.Add("%CX0").Bold = .T.
	.Columns.Add("Description")
	with .Items
		h = .AddItem("Root 1")
		.InsertItem(h,Null,"Child 1")
		.InsertItem(.InsertItem(h,Null,"Child 2"),Null,"Sub-Child 2")
		.DefaultItem = .InsertItem(h,Null,"Child 3")
		.CellState(0,0) = 1
		.DefaultItem = h
		.ExpandItem(0) = .T.
		h = .AddItem("Root 2")
		.InsertItem(h,Null,"Child 1")
		.InsertItem(h,Null,"Child 2")
		.InsertItem(h,Null,"Child 3")
	endwith
	.EndUpdate
endwith
|
|
1015
|
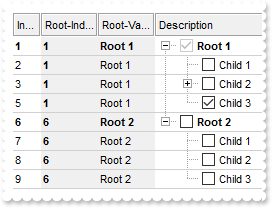
Displays the root item's index and value/caption using expressions
with thisform.Gantt1
	.BeginUpdate
	.HeaderAppearance = 4
	.HeaderHeight = 24
	.LinesAtRoot = -1
	.AutoDrag = 3
	.SingleSel = .F.
	.DrawGridLines = -2
	.GridLineStyle = 48
	.GridLineColor = RGB(208,208,208)
	.ConditionalFormats.Add("%CC0 and %CX0").Bold = .T.
	with .ConditionalFormats.Add("1")
		.Bold = .T.
		.ApplyTo = 2 && 0x2
	endwith
	with .Columns.Add("Description")
		.Def(0) = .T.
		.PartialCheck = .T.
	endwith
	with .Columns.Add("Index")
		.FormatColumn = "1 index ``"
		.Position = 0
		.Width = 16
	endwith
	with .Columns.Add("Root-Index")
		.FormatColumn = "root(1 index ``)"
		.Position = 1
		.Width = 32
		.Def(4) = 15790320
	endwith
	with .Columns.Add("Root-Value")
		.FormatColumn = "root(%0)"
		.Position = 2
		.Width = 32
		.Def(4) = 15790320
	endwith
	with .Items
		h = .AddItem("Root 1")
		.InsertItem(h,Null,"Child 1")
		.InsertItem(.InsertItem(h,Null,"Child 2"),Null,"Sub-Child 2")
		.DefaultItem = .InsertItem(h,Null,"Child 3")
		.CellState(0,0) = 1
		.DefaultItem = h
		.ExpandItem(0) = .T.
		h = .AddItem("Root 2")
		.InsertItem(h,Null,"Child 1")
		.InsertItem(h,Null,"Child 2")
		.InsertItem(h,Null,"Child 3")
		.DefaultItem = h
		.ExpandItem(0) = .T.
	endwith
	.EndUpdate
endwith
|
|
1014
|
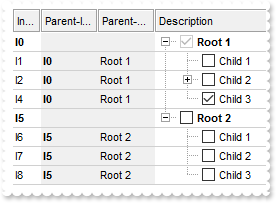
Displays the parent item's index and caption/value using expressions
with thisform.Gantt1
	.BeginUpdate
	.HeaderAppearance = 4
	.HeaderHeight = 24
	.LinesAtRoot = -1
	.AutoDrag = 3
	.SingleSel = .F.
	.DrawGridLines = -2
	.GridLineStyle = 48
	.GridLineColor = RGB(208,208,208)
	.ConditionalFormats.Add("%CC0 and %CX0").Bold = .T.
	with .ConditionalFormats.Add("1")
		.Bold = .T.
		.ApplyTo = 2 && 0x2
	endwith
	with .Columns.Add("Description")
		.Def(0) = .T.
		.PartialCheck = .T.
	endwith
	with .Columns.Add("Index")
		.FormatColumn = "1 index `I`"
		.Position = 0
		.Width = 16
	endwith
	with .Columns.Add("Parent-Index")
		.FormatColumn = "parent(1 index `I`)"
		.Position = 1
		.Width = 32
		.Def(4) = 15790320
	endwith
	with .Columns.Add("Parent-Value")
		.FormatColumn = "parent(%0)"
		.Position = 2
		.Width = 32
		.Def(4) = 15790320
	endwith
	with .Items
		h = .AddItem("Root 1")
		.InsertItem(h,Null,"Child 1")
		.InsertItem(.InsertItem(h,Null,"Child 2"),Null,"Sub-Child 2")
		.DefaultItem = .InsertItem(h,Null,"Child 3")
		.CellState(0,0) = 1
		.DefaultItem = h
		.ExpandItem(0) = .T.
		h = .AddItem("Root 2")
		.InsertItem(h,Null,"Child 1")
		.InsertItem(h,Null,"Child 2")
		.InsertItem(h,Null,"Child 3")
		.DefaultItem = h
		.ExpandItem(0) = .T.
	endwith
	.EndUpdate
endwith
|
|
1013
|
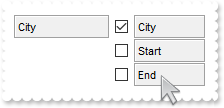
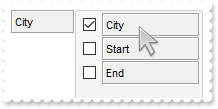
Specify the size of the Columns panel
with thisform.Gantt1
	.BeginUpdate
	.HeaderHeight = 24
	.HeaderAppearance = 4
	with .Columns
		.Add("City")
		.Add("Start").Visible = .F.
		.Add("End").Visible = .F.
	endwith
	.ColumnsFloatBarRect = ",,96"
	.ColumnsFloatBarVisible = 34 && ColumnsFloatBarVisibleEnum.exColumnsFloatBarVisibleAsChild Or ColumnsFloatBarVisibleEnum.exColumnsFloatBarVisibleIncludeCheckColumns
	.EndUpdate
endwith
|
|
1012
|
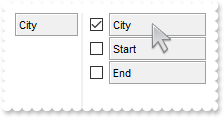
Show a vertical line between pivot and Columns panel (EBN color)
with thisform.Gantt1
	.BeginUpdate
	var_s = "gBFLBCJwBAEHhEJAAEhABRsIQAAYAQGKIYBkAKBQAGaAoDDUNQxQwAAxwfBMKgBBCLIxhEYobgmGIXRpFICQTIcBhaGIZRiAKCRTDmHwyRCNIwCLD8QxtDqBY4gOZZXh"
	var_s = var_s + "al4cJTgMaBYi+Pw3DZHcbvBRkewzHQAKgnSjoDhEMg1CTVVYTDKdOSzDyEX7sIAACpOIZQVJVEY1VT8cyxIyEZimSypWqiYJ0Ty6cQwTAIgI"
	.VisualAppearance.Add(1,var_s)
	.Object.Background(87) = 0x1000000
	.HeaderHeight = 24
	.HeaderAppearance = 4
	with .Columns
		.Add("City")
		.Add("Start").Visible = .F.
		.Add("End").Visible = .F.
	endwith
	.ColumnsFloatBarVisible = 34 && ColumnsFloatBarVisibleEnum.exColumnsFloatBarVisibleAsChild Or ColumnsFloatBarVisibleEnum.exColumnsFloatBarVisibleIncludeCheckColumns
	.EndUpdate
endwith
|
|
1011
|
Change the background of the Columns panel (EBN color)
with thisform.Gantt1
	.BeginUpdate
	var_s = "gBFLBCJwBAEHhEJAAEhABNoCg6AADACAxRDAMgBQKAAzQFAYahqGKGAAGOD4JhUAIIRZGMIjFDcEwxC6NIpAWLoJDCH4mSTHYxgJIMWwzDiBZgkCA4fiGEYnThCIxzTJ"
	var_s = var_s + "0aw1CKbYRAKCUKoUAJFsSnQAJIgOO4lULPMIhDDQKQTIKBahoehqIhaEQyDSJNb2DCIahhMSEbKtCooDhGFZUWzLVxTJJNawHJqJJDuOTpSjKH4+RjWFKUXR9b4BJSNA"
	var_s = var_s + "gqeCQTiSWZEVxRUS0XbGCyZLSQY7uAAMKgOVoDYzdGLwHTtOwrMa1QAsDSbKqWZ5uRpHcQ5aAGN5DPbMbqwOaqLznAaLQLtG4RTikVRPTDYaj437+OaHGyNbI6HTNPpT"
	var_s = var_s + "lWDJWjYXI8l8C4fg6GYAAEEISgGJJGHQOocgyIwYnqKhYAAIQTH2MYRjQJBRAmZptmEAYIjGU5dk8UgOFgBJUgCTQIBYBoBmCCAmAqApghgDJUDmYQFCCZoEk2OBUm+B"
	var_s = var_s + "ZPCgZgagaYZIHYHoHmGWBcm8NwiEiFJVgmYgji4Kg6GKSI2C6C5jAiRgygwIojiycINkyeJmAYPJjkiTg+g+ZAIkCdIQkyWQWDuDxkBkJhKguZAzlIRQzGQc5ODWFJlE"
	var_s = var_s + "kVhWhWZYJFYTYTmUE4yF6F5mAmBhihiZhJhYX4WmQaAUnWGpOlmNhuhuZwJkYcocmcSY4naHZlkmKhrDuJ5JnYfofmgCgGgKIJnlmXJ2h4TQKBosRokoNoOiOaQKDSd4"
	var_s = var_s + "kmiChMncPBpgoZoaiaaZKHaHonmmE5iiKJRpDicomimaoKiaKoqmqSoeiIPgogqPotiyaxKlYPA+GuCqbBMa5KnaPovmwCwGj6LgP24RIhiyCwmkqMpsksNpKD6LQLBq"
	var_s = var_s + "OIzi0SxWlaHZtAOahPssM5Wi+IYtlsXpijKbZ5lyTo5mAE4UlqOpjHOQpEjubyanKPJvEuNgVj2TY1CCao+k2G52AyP5wAwBp9DYZZ1CCaxsAABAEICA"
	.VisualAppearance.Add(1,var_s)
	.Object.Background(87) = 0x1000000
	.HeaderHeight = 24
	.HeaderAppearance = 4
	with .Columns
		.Add("City")
		.Add("Start").Visible = .F.
		.Add("End").Visible = .F.
	endwith
	.ColumnsFloatBarVisible = 34 && ColumnsFloatBarVisibleEnum.exColumnsFloatBarVisibleAsChild Or ColumnsFloatBarVisibleEnum.exColumnsFloatBarVisibleIncludeCheckColumns
	.EndUpdate
endwith
|
|
1010
|
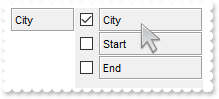
Change the background of the Columns panel (solid color)
with thisform.Gantt1
	.BeginUpdate
	.HeaderHeight = 24
	.HeaderAppearance = 4
	with .Columns
		.Add("City")
		.Add("Start").Visible = .F.
		.Add("End").Visible = .F.
	endwith
	.ColumnsFloatBarVisible = 34 && ColumnsFloatBarVisibleEnum.exColumnsFloatBarVisibleAsChild Or ColumnsFloatBarVisibleEnum.exColumnsFloatBarVisibleIncludeCheckColumns
	.Object.Background(87) = RGB(240,240,240)
	.EndUpdate
endwith
|
|
1009
|
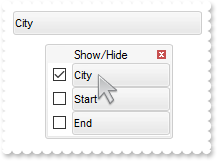
Change the visual appearance of the Columns panel
with thisform.Gantt1
	.BeginUpdate
	var_s = "gBFLBCJwBAEHhEJAAEhABNoCg6AADACAxRDAMgBQKAAzQFAYahqGKGAAGOD4JhUAIIRZGMIjFDcEwxC6NIpAWLoJDCH4mSTHYxgJIMWwzDiBZgkCA4fiGEYnThCIxzTJ"
	var_s = var_s + "0aw1CKbYRAKCUKoUAJFsSnQAJIgOO4lULPMIhDDQKQTIKBahoehqIhaEQyDSJNb2DCIahhMSEbKtCooDhGFZUWzLVxTJJNawHJqJJDuOTpSjKH4+RjWFKUXR9b4BJSNA"
	var_s = var_s + "gqeCQTiSWZEVxRUS0XbGCyZLSQY7uAAMKgOVoDYzdGLwHTtOwrMa1QAsDSbKqWZ5uRpHcQ5aAGN5DPbMbqwOaqLznAaLQLtG4RTikVRPTDYaj437+OaHGyNbI6HTNPpT"
	var_s = var_s + "lWDJWjYXI8l8C4fg6GYAAEEISgGJJGHQOocgyIwYnqKhYAAIQTH2MYRjQJBRAmZptmEAYIjGU5dk8UgOFgBJUgCTQIBYBoBmCCAmAqApghgDJUDmYQFCCZoEk2OBUm+B"
	var_s = var_s + "ZPCgZgagaYZIHYHoHmGWBcm8NwiEiFJVgmYgji4Kg6GKSI2C6C5jAiRgygwIojiycINkyeJmAYPJjkiTg+g+ZAIkCdIQkyWQWDuDxkBkJhKguZAzlIRQzGQc5ODWFJlE"
	var_s = var_s + "kVhWhWZYJFYTYTmUE4yF6F5mAmBhihiZhJhYX4WmQaAUnWGpOlmNhuhuZwJkYcocmcSY4naHZlkmKhrDuJ5JnYfofmgCgGgKIJnlmXJ2h4TQKBosRokoNoOiOaQKDSd4"
	var_s = var_s + "kmiChMncPBpgoZoaiaaZKHaHonmmE5iiKJRpDicomimaoKiaKoqmqSoeiIPgogqPotiyaxKlYPA+GuCqbBMa5KnaPovmwCwGj6LgP24RIhiyCwmkqMpsksNpKD6LQLBq"
	var_s = var_s + "OIzi0SxWlaHZtAOahPssM5Wi+IYtlsXpijKbZ5lyTo5mAE4UlqOpjHOQpEjubyanKPJvEuNgVj2TY1CCao+k2G52AyP5wAwBp9DYZZ1CCaxsAABAEICA"
	.VisualAppearance.Add(1,var_s)
	.Object.Background(92) = 0x1000000
	.Object.Background(93) = RGB(246,246,246)
	.BackColorHeader = 0x1000000
	.HeaderHeight = 24
	.HeaderAppearance = 4
	with .Columns
		.Add("City")
		.Add("Start").Visible = .F.
		.Add("End").Visible = .F.
	endwith
	.Object.Description(26) = "Show/Hide"
	.ColumnsFloatBarVisible = 2
	.EndUpdate
endwith
|
|
1008
|
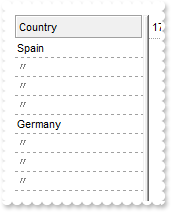
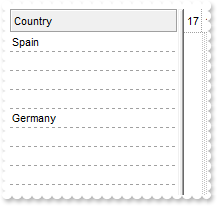
Defines the symbol used to indicate repeated captions, providing a clear visual cue for identical entries (ditto mark)
with thisform.Gantt1
	.BeginUpdate
	.HeaderAppearance = 4
	.HeaderHeight = 24
	.DrawGridLines = -2
	.Columns.Add("Country").ShowIdem = "<fgcolor gray>〃"
	with .Items
		.AddItem("Spain")
		.AddItem("Spain")
		.AddItem("Spain")
		.AddItem("Spain")
		.AddItem("Germany")
		.AddItem("Germany")
		.AddItem("Germany")
		.AddItem("Germany")
	endwith
	.EndUpdate
endwith
|
|
1007
|
Defines the symbol used to indicate repeated captions, providing a clear visual cue for identical entries (space)
with thisform.Gantt1
	.BeginUpdate
	.HeaderAppearance = 4
	.HeaderHeight = 24
	.DrawGridLines = -2
	.Columns.Add("Country").ShowIdem = " "
	with .Items
		.AddItem("Spain")
		.AddItem("Spain")
		.AddItem("Spain")
		.AddItem("Spain")
		.AddItem("Germany")
		.AddItem("Germany")
		.AddItem("Germany")
		.AddItem("Germany")
	endwith
	.EndUpdate
endwith
|
|
1006
|
Displays a glitch funnel for drop-down filter buttons (empty or active)

with thisform.Gantt1
	.BeginUpdate
	with .VisualAppearance
		.RenderType = -1
		var_s = "gBFLBCJwBAEHhEJAAEhABa8IQAAYAQGKIYBkAKBQAGaAoDDUNQxQwAAxwfBMKgBBCLIxhEYobgmGIXRpFMbxCKQahLEiTIhGUYJHgmK4tRiAUgxVDkBxrECZYqjcBZOi"
		var_s = var_s + "wLQ2TxDM7DNKUCBnIoABhGOaYDh+IQNQjUFKwTRFGRxK4EIRKAyTDLQdRyGSMMbjdQpBCbMiMRqhESKRq2UwYRYCFS1NalaztO6BUAvK67YrWez/YBfF+SfwGeqDYReW"
		var_s = var_s + "APfgWERnQrGMLxbD8KwZAKTRjkGJ4XhuB41TbQMqufL9ByXHKSSDpGjaXjeO5VVjYNAvS69UzXNq3bhtQAOXCMEwCgI="
		.Add(1,var_s)
		.Add(2,"CP:1 -2 0 0 0")
	endwith
	.DrawGridLines = -1
	.GridLineStyle = 512
	.ShowFocusRect = .F.
	.Object.Background(0) = 0x2000000
	.Object.Background(41) = 0x2000001
	.HeaderAppearance = 4
	.BackColorHeader = RGB(255,255,255)
	.HeaderHeight = 24
	.HeaderVisible = 1
	with .Columns.Add("1st col")
		.DisplayFilterButton = .T.
		.DisplayFilterPattern = .F.
		.Filter = "Item B"
		.FilterType = 240
	endwith
	.Columns.Add("2nd col")
	with .Items
		.AddItem("Item A")
		.AddItem("Item B")
		.AddItem("Item C")
	endwith
	.ApplyFilter
	.EndUpdate
endwith
|
|
1005
|
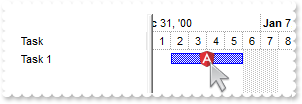
How can I replace or add an icon at runtime
with thisform.Gantt1
	.BeginUpdate
	var_s = "gAAAABgYACEHgUJFEEAAWhUJCEJEEJggEhMCYEXjUbjkJQECj8gj8hAEjkshYEpk8kf8ClsulsvAExmcvf83js5nU7nkCeEcn8boMaocXosCB9Hn09pkzcEuoL/fE+Ok"
	var_s = var_s + "YB0gB9YhIHrddgVcr9aktZADAD8+P8CgIA=="
	.ReplaceIcon(var_s)
	.ReplaceIcon("C:\images\favicon.ico",0)
	.Columns.Add("Task")
	with .Chart
		.FirstVisibleDate = {^2001-1-1}
		.PaneWidth(0) = 128
		.LevelCount = 2
	endwith
	with .Items
		h = .AddItem("Task 1")
		.AddBar(h,"Task",{^2001-1-2},{^2001-1-6},"K1")
		.DefaultItem = h
		.ItemBar(0,"K1",3) = "<img>1</img>"
	endwith
	.EndUpdate
endwith
|
|
1004
|
Can I set a filter that automatically adds a * before and after the word, so the user can just search for 'cat' and it becomes '*cat*' automatically
with thisform.Gantt1
	.BeginUpdate
	.HeaderAppearance = 4
	.HeaderHeight = 24
	.LinesAtRoot = -1
	with .Columns.Add("Items")
		.DisplayFilterButton = .T.
		.DisplayFilterPattern = .T.
		.Def(21) = "*<%filter%>*"
		.FilterType = 3
		.Filter = "1"
	endwith
	with .Items
		h = .AddItem("Root 1")
		.InsertItem(h,Null,"Child 1")
		.InsertItem(h,Null,"Child 2")
		.DefaultItem = h
		.ExpandItem(0) = .T.
		h = .AddItem("Root 2")
		.InsertItem(h,Null,"Child 1")
		.InsertItem(h,Null,"Child 2")
	endwith
	.ApplyFilter
	.EndUpdate
endwith
|
|
1003
|
Load data as a tree using a parent-id relationship

with thisform.Gantt1
	.BeginUpdate
	.ColumnAutoResize = .F.
	.HeaderAppearance = 4
	.HeaderHeight = 24
	.DrawGridLines = 2
	.LinesAtRoot = -1
	rs = CreateObject("ADODB.Recordset")
	with rs
		.Open("Select * FROM Employees WHERE 1=0","Provider=Microsoft.ACE.OLEDB.12.0;Data Source=C:\Program Files\Exontrol\ExGantt\Sample\Access\sample.mdb",3,3)
	endwith
	.DataSource = rs
	.Columns.Item(0).Width = 128
	rs = CreateObject("ADODB.Recordset")
	with rs
		.Open("Employees","Provider=Microsoft.ACE.OLEDB.12.0;Data Source=C:\Program Files\Exontrol\ExGantt\Sample\Access\sample.mdb",3,3)
	endwith
	.PutItems(rs.GetRows(),";0;17")
	.Items.ExpandItem(0) = .T.
	.EndUpdate
endwith
|
|
1002
|
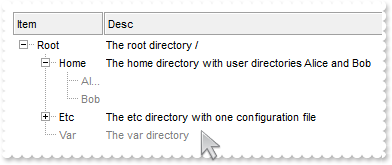
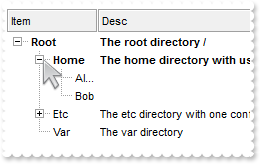
Highlight the leaf items
with thisform.Gantt1
	.BeginUpdate
	.ConditionalFormats.Add("%CC0=0").ForeColor = RGB(128,128,128)
	.HeaderAppearance = 4
	.HeaderHeight = 24
	.LinesAtRoot = -1
	with .Columns
		.Add("Item").Width = 16
		.Add("Desc")
	endwith
	with .Items
		hR = .AddItem("Root")
		.DefaultItem = hR
		.CellCaption(0,1) = "The root directory /"
		h = .InsertItem(hR,Null,"Home")
		.DefaultItem = h
		.CellCaption(0,1) = "The home directory with user directories Alice and Bob"
		.InsertItem(h,Null,"Alice")
		.InsertItem(h,Null,"Bob")
		.DefaultItem = h
		.ExpandItem(0) = .T.
		h = .InsertItem(hR,Null,"Etc")
		.DefaultItem = h
		.CellCaption(0,1) = "The etc directory with one configuration file"
		h = .InsertItem(h,Null,"nginx.conf")
		.DefaultItem = .InsertItem(hR,Null,"Var")
		.CellCaption(0,1) = "The var directory"
		.DefaultItem = hR
		.ExpandItem(0) = .T.
	endwith
	.EndUpdate
endwith
|
|
1001
|
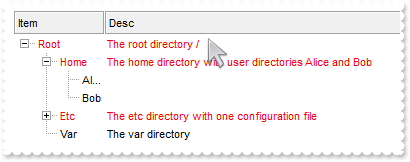
Highlight the parent items
with thisform.Gantt1
	.BeginUpdate
	.ConditionalFormats.Add("%CC0").ForeColor = RGB(255,0,0)
	.HeaderAppearance = 4
	.HeaderHeight = 24
	.LinesAtRoot = -1
	with .Columns
		.Add("Item").Width = 16
		.Add("Desc")
	endwith
	with .Items
		hR = .AddItem("Root")
		.DefaultItem = hR
		.CellCaption(0,1) = "The root directory /"
		h = .InsertItem(hR,Null,"Home")
		.DefaultItem = h
		.CellCaption(0,1) = "The home directory with user directories Alice and Bob"
		.InsertItem(h,Null,"Alice")
		.InsertItem(h,Null,"Bob")
		.DefaultItem = h
		.ExpandItem(0) = .T.
		h = .InsertItem(hR,Null,"Etc")
		.DefaultItem = h
		.CellCaption(0,1) = "The etc directory with one configuration file"
		h = .InsertItem(h,Null,"nginx.conf")
		.DefaultItem = .InsertItem(hR,Null,"Var")
		.CellCaption(0,1) = "The var directory"
		.DefaultItem = hR
		.ExpandItem(0) = .T.
	endwith
	.EndUpdate
endwith
|
|
1000
|
Highlight the item being expanded or collapsed
with thisform.Gantt1
	.BeginUpdate
	.ConditionalFormats.Add("%CX0").Bold = .T.
	.HeaderAppearance = 4
	.HeaderHeight = 24
	.LinesAtRoot = -1
	with .Columns
		.Add("Item").Width = 16
		.Add("Desc")
	endwith
	with .Items
		hR = .AddItem("Root")
		.DefaultItem = hR
		.CellCaption(0,1) = "The root directory /"
		h = .InsertItem(hR,Null,"Home")
		.DefaultItem = h
		.CellCaption(0,1) = "The home directory with user directories Alice and Bob"
		.InsertItem(h,Null,"Alice")
		.InsertItem(h,Null,"Bob")
		.DefaultItem = h
		.ExpandItem(0) = .T.
		h = .InsertItem(hR,Null,"Etc")
		.DefaultItem = h
		.CellCaption(0,1) = "The etc directory with one configuration file"
		h = .InsertItem(h,Null,"nginx.conf")
		.DefaultItem = .InsertItem(hR,Null,"Var")
		.CellCaption(0,1) = "The var directory"
		.DefaultItem = hR
		.ExpandItem(0) = .T.
	endwith
	.EndUpdate
endwith
|
|
999
|
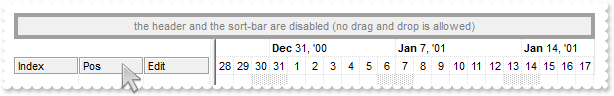
Disable temporarily the column's sort, resize and drag and drop
with thisform.Gantt1
	.BeginUpdate
	.OnResizeControl = 1
	.SortBarVisible = .T.
	.SortBarCaption = "<fgcolor 808080><c>the header and the sort-bar are disabled (no drag and drop is allowed)"
	.HeaderEnabled = .F.
	.HeaderAppearance = 4
	.Columns.Add("Index").FormatColumn = "1 index ``"
	.Columns.Add("Pos").FormatColumn = "1 apos ``"
	.Columns.Add("Edit")
	.GridLineStyle = 512
	.DrawGridLines = 2
	.GridLineColor = RGB(224,224,224)
	with .Chart
		.LevelCount = 2
		.FirstVisibleDate = {^2000-12-28}
		.PaneWidth(0) = 196
		.GridLineStyle = 512
		.DrawGridLines = -1
		with .Level(1)
			.DrawGridLines = .T.
			.GridLineColor = thisform.Gantt1.GridLineColor
		endwith
	endwith
	.EndUpdate
endwith
|
|
998
|
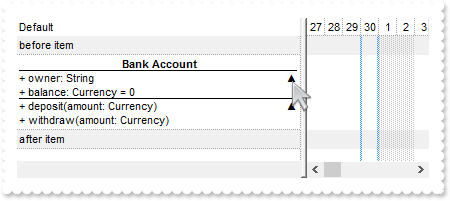
Expandable-caption
*** AnchorClick event - Occurs when an anchor element is clicked. ***
LPARAMETERS AnchorID, Options
	with thisform.Gantt1
		DEBUGOUT( AnchorID )
	endwith

with thisform.Gantt1
	.BeginUpdate
	.ColumnAutoResize = .T.
	.TreeColumnIndex = -1
	.DrawGridLines = -1
	.GridLineStyle = 512
	.BackColorAlternate = RGB(240,240,240)
	.ShowFocusRect = .F.
	.Columns.Add("Default")
	with .Items
		.AddItem("before item")
		var_s = "<solidline> <c><b>Bank Account</b></solidline><br>+ owner: String <r><a 1;e64=gA8ABzABvABsABpABkg8JABuABlAA+AAgAECMcTi4AMwAM4AjM"
		var_s = var_s + "GhEGOUVAA4AAwk8plcqihwAElg0wiUlOkOiUEgQvgcFhsKhkIhUQiUUnccj0gn0jmMagUlowAMNOpEfkMNkkmlEqrctjQmAAjAA5AA2sssHcbnkdq1Ln1QtVSjQAAEBA"
		var_s = var_s + "==>▲</a><br><solidline>+ balance: Currency = 0</solidline><br>+ deposit(amount: Currency)<r><a 2;e64=gA8ABjAA+AECMwAM8DABv"
		var_s = var_s + "ABshoAOQAEAAHAAGEWjEajMGNoAMoAOgANERMgAOcHAAvAEJhcEh0Qh0Tg0CmkqMMFlUuhkxiMTisXjNCjk6EwAEYAHIAG1MjY7lUsnkwh8/nUClk5gwAAEBA==>`"
		var_s = var_s + "50;</a><br>+ withdraw(amount: Currency)"
		h = .AddItem(var_s)
		.DefaultItem = h
		.CellCaptionFormat(0,0) = 1
		.DefaultItem = h
		.CellSingleLine(0,0) = .F.
		.AddItem("after item")
	endwith
	.EndUpdate
endwith
|
|
997
|
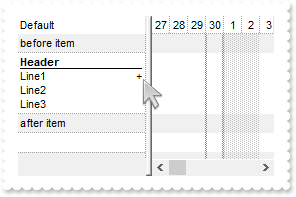
Expandable-caption
with thisform.Gantt1
	.BeginUpdate
	.ColumnAutoResize = .T.
	.TreeColumnIndex = -1
	.DrawGridLines = -1
	.GridLineStyle = 512
	.BackColorAlternate = RGB(240,240,240)
	.ShowFocusRect = .F.
	.Columns.Add("Default")
	with .Items
		.AddItem("before item")
		h = .AddItem("<solidline><b>Header</b></solidline><br>Line1<r><a ;exp=show lines>+</a><br>Line2<br>Line3")
		.DefaultItem = h
		.CellCaptionFormat(0,0) = 1
		.DefaultItem = h
		.CellSingleLine(0,0) = .F.
		.AddItem("after item")
	endwith
	.EndUpdate
endwith
|
|
996
|
Force hover-all feature
with thisform.Gantt1
	.Object.Background(500) = -1
endwith
|
|
995
|
Disable hover-all feature (Windows 11 or greater)
with thisform.Gantt1
	.Object.Background(500) = RGB(1,0,0)
endwith
|
|
994
|
Display a custom tooltip
*** MouseMove event - Occurs when the user moves the mouse. ***
LPARAMETERS Button, Shift, X, Y
	with thisform.Gantt1
		.ShowToolTip("new content","",Null,"+8","+8")
	endwith
|
|
993
|
Shows the tooltip of the object moved relative to its default position
*** MouseMove event - Occurs when the user moves the mouse. ***
LPARAMETERS Button, Shift, X, Y
	with thisform.Gantt1
		.ShowToolTip("<null>","<null>",Null,"+8","+8")
	endwith

with thisform.Gantt1
	.ColumnAutoResize = .F.
	.Columns.Add("tootip").ToolTip = "this is a tooltip assigned to a column"
endwith
|
|
992
|
How do I prevent changing the cell's state ( check-box state )
*** CellStateChanging event - Fired before cell's state is about to be changed. ***
LPARAMETERS Item, ColIndex, NewState
	with thisform.Gantt1
		with .Items
			NewState = .CellState(Item,ColIndex)
		endwith
	endwith

with thisform.Gantt1
	.BeginUpdate
	.LinesAtRoot = -1
	with .Columns.Add("P1")
		.Def(0) = .T.
		.PartialCheck = .T.
	endwith
	with .Columns.Add("P2")
		.Def(0) = .T.
		.PartialCheck = .T.
	endwith
	with .Items
		h = .AddItem("Root")
		.InsertItem(h,Null,"Child 1")
		.InsertItem(h,Null,"Child 2")
		.DefaultItem = h
		.ExpandItem(0) = .T.
	endwith
	.EndUpdate
endwith
|
|
991
|
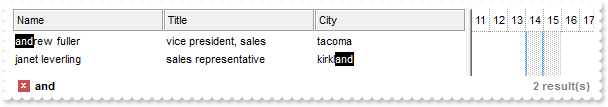
Highlight the match once the filter is applied
*** FilterChange event - Occurs when the filter was changed. ***
LPARAMETERS nop
	with thisform.Gantt1
		format = .FormatABC("`lower(value) replace lower('` + value + `') with '<bgcolor 000000><fgcolor FFFFFF>` + value  + `</fgcolor></bgcolor>'`",.FilterBarPromptPattern)
		.Columns.Item(0).FormatColumn = format
		.Columns.Item(1).FormatColumn = format
		.Columns.Item(2).FormatColumn = format
	endwith

with thisform.Gantt1
	.BeginUpdate
	.SelBackColor = .BackColor
	.SelForeColor = .ForeColor
	.ColumnAutoResize = .T.
	.ContinueColumnScroll = 0
	.MarkSearchColumn = .F.
	.SearchColumnIndex = 1
	.HeaderAppearance = 4
	.HeaderHeight = 23
	.BackColorLevelHeader = .BackColor
	.FilterBarCaption = "`<b>` + value + `</b><r><fgcolor=808080>` + ( matchitemcount < 0 ? abs(matchitemcount + 1) + ` result(s)` : ``)"
	.FilterBarPromptVisible = 2055 && FilterBarVisibleEnum.exFilterBarCompact Or FilterBarVisibleEnum.exFilterBarCaptionVisible Or FilterBarVisibleEnum.exFilterBarVisible Or FilterBarVisibleEnum.exFilterBarPromptVisible
	.FilterBarBackColor = .BackColor
	.FilterBarPromptPattern = "and"
	with .Columns
		with .Add("Name")
			.Def(17) = 1
			.FormatColumn = "lower(value)"
		endwith
		with .Add("Title")
			.Def(17) = 1
			.FormatColumn = "lower(value)"
		endwith
		with .Add("City")
			.Def(17) = 1
			.FormatColumn = "lower(value)"
		endwith
	endwith
	with .Items
		h0 = .AddItem("Nancy Davolio")
		.DefaultItem = h0
		.CellCaption(0,1) = "Sales Representative"
		.DefaultItem = h0
		.CellCaption(0,2) = "Seattle"
		h0 = .AddItem("Andrew Fuller")
		.DefaultItem = h0
		.CellCaption(0,1) = "Vice President, Sales"
		.DefaultItem = h0
		.CellCaption(0,2) = "Tacoma"
		.DefaultItem = h0
		.SelectItem(0) = 1
		h0 = .AddItem("Janet Leverling")
		.DefaultItem = h0
		.CellCaption(0,1) = "Sales Representative"
		.DefaultItem = h0
		.CellCaption(0,2) = "Kirkland"
		h0 = .AddItem("Margaret Peacock")
		.DefaultItem = h0
		.CellCaption(0,1) = "Sales Representative"
		.DefaultItem = h0
		.CellCaption(0,2) = "Redmond"
		h0 = .AddItem("Steven Buchanan")
		.DefaultItem = h0
		.CellCaption(0,1) = "Sales Manager"
		.DefaultItem = h0
		.CellCaption(0,2) = "London"
		h0 = .AddItem("Michael Suyama")
		.DefaultItem = h0
		.CellCaption(0,1) = "Sales Representative"
		.DefaultItem = h0
		.CellCaption(0,2) = "London"
		h0 = .AddItem("Robert King")
		.DefaultItem = h0
		.CellCaption(0,1) = "Sales Representative"
		.DefaultItem = h0
		.CellCaption(0,2) = "London"
		h0 = .AddItem("Laura Callahan")
		.DefaultItem = h0
		.CellCaption(0,1) = "Inside Sales Coordinator"
		.DefaultItem = h0
		.CellCaption(0,2) = "Seattle"
		h0 = .AddItem("Anne Dodsworth")
		.DefaultItem = h0
		.CellCaption(0,1) = "Sales Representative"
		.DefaultItem = h0
		.CellCaption(0,2) = "London"
	endwith
	.EndUpdate
endwith
|
|
990
|
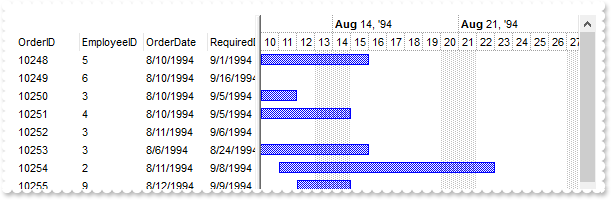
ADOR, MDB (JET)
*** AddItem event - Occurs after a new Item has been inserted to Items collection. ***
LPARAMETERS Item
	with thisform.Gantt1
		with .Items
			.AddBar(Item,"Task",.CellCaption(Item,2),.CellCaption(Item,4))
		endwith
	endwith

with thisform.Gantt1
	.BeginUpdate
	with .Chart
		.PaneWidth(0) = 256
		.FirstVisibleDate = {^1994-8-10}
		.LevelCount = 2
	endwith
	.ColumnAutoResize = .F.
	.ContinueColumnScroll = .F.
	rs = CreateObject("ADOR.Recordset")
	with rs
		.Open("Orders","Provider=Microsoft.Jet.OLEDB.4.0;Data Source=C:\Program Files\Exontrol\ExGantt\Sample\Access\SAMPLE.MDB",3,3)
	endwith
	.DataSource = rs
	.EndUpdate
endwith
|
|
989
|
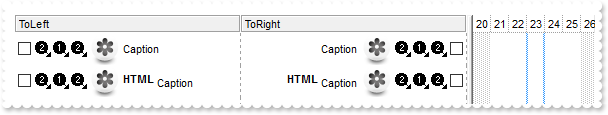
Re-order the cell's caption, icons and images/pictures
with thisform.Gantt1
	.BeginUpdate
	.ColumnAutoResize = .T.
	var_s = "gBJJgBAICAADAAEAAQhYAf8Pf4hh0QihCJo2AEZjQAjEZFEaIEahkZAIAEEbjMjlErlktl0vmExmUzmk1m03nE5nU7nk9n0/oFBoVDolFo1HpFJpVLplNp1PqFRqVTql"
	var_s = var_s + "Vq1XrFZrVbrlTiFdib/sNjr9gs1nldlrlqtFtt0stlguNvulyh91ud1vVVvNuvt7wFHr9/vl3luEwOJouIq+Dw2KyGRyWTymVy2XzGZzUuiw+lmej0gkUaksljaAnmDc"
	var_s = var_s + "D/cEbf7w1+ufD/fEbeB028bYAO3enB6AB++4EoA4A4sb4vHjXJ4nG5vKAHA4ca6XBjTAD/Y2x/eB/jcB"
	.Images(var_s)
	with .Columns.Add("ToLeft")
		.Def(0) = .T.
	endwith
	with .Columns.Add("ToRight")
		.Def(0) = .T.
		.Def(34) = "caption,picture,icons,icon,check"
	endwith
	.DefaultItemHeight = 32
	.DrawGridLines = 2
	.HeaderAppearance = 4
	with .Items
		h = .AddItem("Caption")
		.DefaultItem = h
		.CellImage(0,0) = 2
		.DefaultItem = h
		.CellImages(0,0) = "1,2"
		.DefaultItem = h
		var_s1 = "loadpicture(`gCJKBOI4NBQaBQAhQNJJIIhShQAEEREAIA0ROZ6PT0hQKYZpIZDKBJkIgKByN5mNJsMsKPABVqXBI4KjrD7HL6GWKPJKiCIhMiySidKxbOzZZJWMLsG"
		var_s1 = var_s1 + "L2FqyLjZMonNa2CyiZDOUqsQqUEq0ZCNISFXDIFxzZ4hUrbdrefZ/fz3ZgzZ75Tz3XjvHZnZznPieb55AKgAqmRyOOzEhR7XirWaWQQMTa+QIhDbZOZAAoYUCPDAQG7F"
		var_s1 = var_s1 + "XI4JRrNCoIRdPyyFr0AYifDUKZ+PCufK4RReALLUbtdBHSrGTCCNKqT4MbRqUxxQx+CAAEQ2VCBbxqGaLYDZNgzFbCbLDarRCrqMYMM6cWqpHKUDqhZjnVijEoLcp0FC"
		var_s1 = var_s1 + "jVg2OYhTjN/QWk4bo4iseBsAcABIDoPA5g2HgADIkQfDCNxwkEQYnFmAIAB4OJHGcKAPioGRKFKdh2g6UB8iiZ5QkYQp3gKWhDlsWYmAARBcgCIAUniVpmiSA5AF3A4w"
		var_s1 = var_s1 + "G8P41nGWwDDAW4MAAIpSG+bRzBoGx3AeCJhh6C4ljCUJGnSRBUFKAIQA6EgIHMWBoHqYgAngHJDCALBmhCCAfHOARAScUBvAmc5zHYXxoguXQ8DEMIAH8dI8HmP4/AyQ"
		var_s1 = var_s1 + "JAEAYAoHqRByEQGJiECBAzAkKIpBYNIcikAp8kcZhDn4EBChmUoMgqHIqhiWoIgaDImgyVQImaRw/F0EZGCcSw3DaM4Kn6GBBhwYYZDGZo3C+RgOAmNQnhYeYqgsTZen"
		var_s1 = var_s1 + "EVgSFYLo2CydhGg4OROF2HJjlydR7i+cJjDGFo8BgHgVl4Po+DufJRgcbQOlkCxyKuCJNAsdwIhSC4mgieYKkeHJWD0Ih8BQaYYkkMYppwTg0EsFhJC0SxEkgeodDSFp"
		var_s1 = var_s1 + "TheV5SDgLBIieRIigyVo5CeOpymoWhtEQfRACMR4zE2KxRnsV5dF2ehFCeC50G+GBkBiZgaCUGYnBySY+BsdIuEkJJJDSSRsjGeYqEWOhliYVYOHWDYbFuNhFmcS5siq"
		var_s1 = var_s1 + "bZrnGLYOh0DpPhyXo7D8d4ZHGXR1CcdRAnsMh7GELwIHiSx7CiXY0HYNZ1nOcoPg0SB+CWLwwGqUpbFAQJwEeEImlCVQwk4cJxAiFRIhMS4ulGYRRlmMQVDEHZxG8YxX"
		var_s1 = var_s1 + "hIaQSniLhIiaGwnDiJZGicZYnjeZw8D6OoSkWEIthwI4emudwtGwepNhuLQ3F8Zojm4bQrhALo0D0HZwCcJwoimeI0ASWR6CAJkJQORfAiFcLIXgahaiGCgMsKIpw8DP"
		var_s1 = var_s1 + "H8H4Pj2BhjrBMGQGYfxFjuEGIsB4rxbg+DSFsPAxBtChHoAQaYmRojVG0D0e6JALjVD2K0F4qxfjjGyPIRY/QXi1AOAILwFQGgOF8KYDwOgdBsHmCYcobRtjIHoGgZAm"
		var_s1 = var_s1 + "Bgi7HgPcWoHxTAmCQCcVwTgDB+FYJgfQMAOj0F2PoZgkRMjeKQLkWATwdDzEkPMF4FxzAXDGJYfAlgPAuB+FkeIWxuizC0LkUwvQbD9ByHIDouxvBCBgCMCAvh4CXCME"
		var_s1 = var_s1 + "gSA0BJDEH+AsfwMgfjhDeL0Ro/xkgvH4JMXA7RYjyAONgPAWhfjyCuBEcAFRSAWE4BIOwEAUgTCaIYfA4wSBUAcAsDowQOBFA4J0Hg9h2B4EmCQTYVBdB0FwIwU4rByj"
		var_s1 = var_s1 + "JGmHIRQ8gJAKB4IoZgShaDKAQOUIolQkjVBuGoSw6hugaFaJoeoWgajaDKDoO4dB5j0FcJ0Zw1Ang3CQDEdgNQnA6EmHgGw4QuCiCSAKFIXBgilEwGcLAZAtDmC0N0Wg"
		var_s1 = var_s1 + "LhaApFiK0HgfxniuGKP4GIvhrhhGgHEZgaRtB5GSBUcIhg5BnHkOAeQFB5A6DiEEao2xoDHH0KIQ4bxYBfFEP8RogB5BfA8AQHwvwqAZBIBURgCgwgPAqAkKYCgfgTHC"
		var_s1 = var_s1 + "BwDIegcgjFUDQXQPQzA4DsCkDwnRABNAwE8OgTw5C6AkJEPgPRSg+DqCANoMRBjuHUKEJglQWDrHYOATg3BuDGDWEMa4CQbj3HMB0Z4Pw5jLFuCAWYsB/D2DgBEUQmB1"
		var_s1 = var_s1 + "iuDEMkfI0hUCyEkPIfwihKgqGsGobIGhNhfFGGoZY6gDDuGWDceANA1A2DyDUM4txaA/EwG0bo0wTDXEcH8Sg/BcD2GSHQC4pgtiuGOOkNIRg3hbG+MIGYjhzgaBeHwL"
		var_s1 = var_s1 + "4FgHAMAYFIfgJh4nJBQGkfAwRNiFAiO4KIlhoiKFiOoO4EwPiYGONUE4RATg6BOMcUwEApgZGmP4X4lxnjYGaLIZg7RNirH6FQG47xZCAC6OQLK5B1BYF8LgOQZAqh0F"
		var_s1 = var_s1 + "qGcBo/xMhpE6HsXomQwBKCwIcfA6w/DxA+IURAIxwgmBSCMKoJgOhFD0JMeIkQdhREwFAEQKRFioAYKkJIqQlhpBYFEPYUQui0GCGgFI9BlCOAUDoS4nRhA7HOOkFYdg"
		var_s1 = var_s1 + "uhgEgGYUgZB2DeE6IIYIMQEgyAiPYHgYgnBlFiNsPYghKiODqISfddhPgVEOCQE4hg5iWHWPEfwfB3BgFYPkAIWQPAOC8BIb1MwrD+QsNEQ43ACAMAKGUQgsBhBoHCGU"
		var_s1 = var_s1 + "SNrxBBoEqNgGo8QMAJF+MMOwRxGCOFUBwHYdhODvDwMEBILgk21AKKkOI6RrgyD6LIDoJxNjkDUOQF4yAXgoC4FMXgqhKCiE4KACQow9D5CoJgLQiA9CwEMLUYwOxmhA"
		var_s1 = var_s1 + "FaEAdoSwdBBF0CEPQEWWDrGOBoEgGhTAaDyBsPoNgXA4CmHIWw+guCDCSJsNIjxsgADcNQPg2hxC2FKLACo2hNDFEMMcKw/BeCcE6LYXoGRvDJGCN8GIxgUjYAyOUbg6"
		var_s1 = var_s1 + "BpDrB0OYWw5AgjtGSOoEofAgjRG2NgY4+RRCfBeKUN4qQvi7H+HAYAchwCOCWAcQQZBBFiG4EIUYww3CFFuEQSgRAlBdDMIwCQiRrCMGCMcIwxhuiKDeE0PAlxCC8GFZ"
		var_s1 = var_s1 + "QS4YhIgaEkJYS43hLAxE8EkTodQUBbBWMcHoNxy0lHqOETYyAeDeD4I0AQlRhD0G2E0O4PgKCjHeEoSgmBKCGEsBUS4vxUA8C6M0K4ox7irD+O0VouhfD7FUA33I+gmi"
		var_s1 = var_s1 + "XE0IsLY1gtipG0CQbQLQPjFDuDQHw2RtjFGsK0bw4x9j0CcO8N4/RtBnhSgvAcBehmAOh0ANgiAhAnhih8gwh1gbhugRhSBRhDhjh2Bvgyhfh3gPhThOBIBOA6B9gsAY"
		var_s1 = var_s1 + "Aah+BdhlBWBtAuBoBThtB8gnhFheAlhcByh6BKhvAahNBnh5B1gJB1g+hCAsgAAbB1gOguAJhIAoAmhFBvqzACABh0BlgFggA6CaBvBQA7BDEHAaA0AABoAcgGBEACg5"
		var_s1 = var_s1 + "AAgYgZgLAIBKgFBBhWh9AggCAIBoBNgAANA9AJhwABBxBwAKAYAAALCJu9ADAYAFBLExBEAiBEgmBEgxBEANBENbhmgJh5gJBNgJgzgJBfgRAvAhpKhnAQg5AIpkARAS"
		var_s1 = var_s1 + "A/ASKGAPBJhZBIAdBJAbARh7n4BIhshkAnAZDVgkBZAUg5AWh5AVB5AEgFAbBFA4BFACglA5hlAfAVAChVAtBVAig1AQh1ABBNB+gaAcgUA7AqAbAWgTg2gfB2gSB9AI"
		var_s1 = var_s1 + "BdA1BDh2BHAnBdAZg6Apgdh+h0g7lCBoAXh3BJBugahkBwBihkBkAsBYgtg/h7gNATBNgkhIgUhBg0gzI6BZgJRJglhvAvARgrAtBrALBbBFh2BxB2BZh9hFAcgOAcAd"
		var_s1 = var_s1 + "AcgCgcBzhcAVB7h9g5BlgxhohsArgDh5A8heA8BKh8hMB8gzB8APgPBmAdByAShQAVgUAWMMAaAThuATgpAWhNASgLARB3ASAwg+AsEwhiAoimBTBxhUAJhEAJhVhJBP"
		var_s1 = var_s1 + "hSBTBSBjgyhvBPlWAbgUgfhRhYBUAkAoBTAoBQgrgygfyhgTBShXBSgwhUh0hWgKhTguhQBphRAdhWAjhoBvg1gQA0g0A1AKACAehLgegzgrgmhcAmBahmB+A4AihzAh"
		var_s1 = var_s1 + "hLA6ArAFBrAfAbAyhbAPh2hYB7BzB8AOBDgwhTg+hnALAXB8hXBph3AxAPA/BPA2gLg7A8hxg+AlAXANB9ARB+A6B+h5gBgEBAg9BLhFBBAUghAWAhANhhhsgRgBARBv"
		var_s1 = var_s1 + "gjAUgiALhjBpBig8hjhHgSA1ASBqgvA4gkhzAmgkglhRgnB7hlh8BKA0hNgxhMBtg7guh5gjAzhPAtB/BJgBBmhhBvAdhDAighg7g2glAzBlg+AVhUAVAphVAHhqURAG"
		var_s1 = var_s1 + "hvh7g0AgAahvA2FigMg2BhhaBrg6AMAegTA6AVi5B6BlgehNgMgoA9gigMAZA/hBgMgGg+hfgbAvAegSgbApgegXhZhqBagzBYgogfgwB/Cwg7hgh/hDA/gTg5B+gNh/"
		var_s1 = var_s1 + "gXh6B8hbh8B/hEhfASg2h/BHh6BfhZBbhuAjB/g9h7BbBth0h/gbh2Ayh/hAh+h/gnh/Ajh3AwgnA/gigPBzBPBVBegigfA1h8BPhshr1HgNhvAxB/hoBdgGgBhZh3sU"
		var_s1 = var_s1 + "hMh0gmh1hLg9hIgchQB7BthugQh5hbgugth6BTgLi/ALBkocoPgCA/BQBfhmh+hXhzA/hzh+g7B1hbgch/heh4gvhEg3hsBfBOgbA2B9ArhrANhPTSKXAMg7A+Bhh4Af"
		var_s1 = var_s1 + "gZh/AVhdg/hzB7BTBsgfh5B+gdhZh/g7oQBogSh/BMrPhUhYBshvheBfA9AThph7ANhvhNgog/hZBNg/hdhvgIAxhjB2hHBhhOBtg1gPBCg3hZBDAmhDg0gfhNhAg8xM"
		var_s1 = var_s1 + "hgBiBvkig7BGgKBHBDBfBJhDBWhPg6BPxKAvBOBUhPB5hMhLhAh0mXBXAFhhB/A3hXBIhwB9AAgUBKg4AHA8AMgdgDhuB8hGghhcACgUAAgOA4AAA8AQABh2BQAegHA2"
		var_s1 = var_s1 + "BOB9BYhxhrBAA/hfg7hah4BCBrAxgABkAdAcK4BtgsAshdhZCSAVglgFgbASgeB3AQAPhNhIFJ2TBnhahchDBBh9gQBogABSAlhhBUgbBLANBvA+hbh+gAgWBzB5BXBW"
		var_s1 = var_s1 + "hFh/knAAADgLAkgiAggqAsAEhigrA1g2AKAqgKBfAZgdh9g2BbhugjhUgCgtgBALAtAYy+AWhEgmgAhFgSAaT4gAASgaATAahIgxACB9ghhGgfgmBoAEB4gIg/ANBagx"
		var_s1 = var_s1 + "AkhGBRA0gs3yBaBjTNAFBCBFBghCACAJAlhFh+AAAEgCAQgQg+h2g7Bbhdgdgdhdhxh7gGvUhbBHhah/B5ATAzh3BOtAWchuh3hOA9h3XvAfgbh0hfh8Brg6hegDB9Bt"
		var_s1 = var_s1 + "nWDQByA4gkAGJIAZAEgcgFh8gvBJBSAdh0BLhqBLACAABHBtgwB2x8yngsg+gAByA2gAB8hxhvh6Byg+AFBp4nBShMgmBzANgAB8ACBZADARBLPVhQh7uKBOg/B7hqBU"
		var_s1 = var_s1 + "gphbA+AfALAygQYohXBZi2AThYhcAeBPhAuwhdgIBEgiB7B9YzhDA0AvAthIBAg8AeBfApAohKA/B2BRA+BYm/gGBCguAG5JhAhjZLAgAvgvhPg1gYgehmAbgLZQhDAj"
		var_s1 = var_s1 + "AjgjgOh5heAxzgABhx5Wgig0AfgQA/B13iBgBchVgrhXgVXFhbh9gKBdgugUAbXDgygsg+A/B+B8AqA6g6hahbBsANBmA/hCgmhegeSVgeADBwB+BKg+BnA0hwBxBihF"
		var_s1 = var_s1 + "h7BxBxAxAIgGACAiAYAMAKA/BPgnguAMgPBbBngak8B+hsgqAVBag2hnBOAoBWAJhYgsA2AchvAHhIEMAmgmAmAkAjhHgPB6hUBkhSAqApgpjehsBcgZhAhuAYBOBdAu"
		var_s1 = var_s1 + "AXAwgpgPBMBwAOB5AjB+AeAYBwANACghgnBTgph3h0B0BMB4h91BgMAJhxAmgSByhshbajBaWPgTgCAYA4ACWGg3g/AyBfgzhnhPBxA1hrhXBshehChChRBQBQAgAeAF"
		var_s1 = var_s1 + "BNAtg7h3hHB7h7B7A9BOgHBDgggfhrBEBHA+h9gRB+68hPAfg3huAoAzbAAiAGBZA7B2htAqB7hYgxgwhVgehOVIFFBRgchLhhgAA7BfBthdB9hkhkgkg0hyBlAKhBg3"
		var_s1 = var_s1 + "ABAgAZBEg4AcBWAGYIhzgXAEgDA6gmhphwAtgRBYBmBwBwBQAThBA3gvBXn3hrBDBuBcA/BugnANgEBLhKhCgzhwYzhAAiARAohGgHgggJgMg9gMBrA4g+A6BoAUhchu"
		var_s1 = var_s1 + "g3BBgAhZAIBPBNApAFAFAFh6hZBZAZAWhMgkAkBEgyApb1BOAqBGBIBmATAShAhsgOgHBuhxh4gsBOhph2ArAfBmBLCWgigxgOhZhshtAMBrghhDgHgjgfrIB5ABBCBQ"
		var_s1 = var_s1 + "AcAgV4gPhcgIBWhVhXgnhBApA4hVBXhngFhTLMgcgOhRgtAMh+hFh2h2gohnAsgshCg+rTAGgNhcgjgvwhAsA0BOA8gV4dBN8qBJh68rgUgoB2BdA6h5hTABhMgWAxhT"
		var_s1 = var_s1 + "g9A2guguhJBDB0g4B5hzBmsvhwgwgzgog4g4gDAmAygPBUhWAqANgbg3AmBAI2AOBzhDA8hmBKgxBIAFgAAJhbCuhGgKl7BwhwAmgcAKAigDh2gZAJArABANgDBegx5W"
		var_s1 = var_s1 + "gZADgwBGBEAkBegAg2AYg9gwKABtBmhPABBoBZAPgFhHBMAPhmB/B6bdhZhdhdhth1hh8lBGgIBEAUgOhEgKgVgrA0AngaAaBiBIgyB5A3gLgXBcAEhlJjAJgEAsAJAk"
		var_s1 = var_s1 + "gqqlhththThrhrhrBVBTAWhZhDhPhThIBWARg+Bn7Sg7A3gDhZAvAphEgegGgehuhpAJAyAJBZQ9gBggAAgAgwBDg3BCAAhkgTh0hkAAhLhthWhTgqAqhJBIAhhmAEgq"
		var_s1 = var_s1 + "gqgCgbBiB6h9BD8zhxhmABrOhfAqhMg7ghwiA4BSJNhMgqg4BEhkY8AjBphNATBaA6AtAwBYgEACBBiEBABIAggbg7gmh1AlglAlgahXBmhmB1BgBPBEAmAnwZgogyhV"
		var_s1 = var_s1 + "gmgABcgxsNBUAWAAB2B4AHBvA5h3B3ggAQBIAwg+hPhSgqBQCEA/gQBQA2htKUgfAJhFgkhkAYBtAIAMHpgbAasHg0gVAsBhhIgbBVAxAi/MgFBnAZBDBpB2ABgwADBW"
		var_s1 = var_s1 + "h3gchuBwBxhrhkB1BbhWAFAP5mBCghgTgnA8AgBV+OgqhSg2g1g3AnBOAcg+hNAYgbhHBRg8g6BjhjhjA2ADgdAdhTg/Aeg/hvA6h1h7A2gChLhKfjAdAxhahigYgMAG"
		var_s1 = var_s1 + "Ashzg5AAaYh/AGAjh2AChABwBOgwXnBFh/ApAzgT2GBZBGvTBHAjBGhAF0wAgsDi1w4Nza2UkyBUYiA+maxm6g1K32ad3s2Qg8AKlRaBlKD1wKE+rCCjSObAK8iGsFOr"
		var_s1 = var_s1 + "C0vR0lTeDV8IUatHu6GO2jkAHgAwgfgC5TYrVsKk2Y3MBRcpBQkgmOUuznY2FqKy0WSymXeX0ASwel0olHI5AwJ1mx0gL1mTXU6XS8Vpdj4hyg8BemDYZHqMFOUyYZTW"
		var_s1 = var_s1 + "P1WJ1CN1MTR6gH4cmysjKr2mlCqn3GuR+jDoJHGWlKkU+ajXpgg1yq2FQDFigSEBROwkCKnQwGwjliIU45x2HGyIB4dnM0UmUC+PhaLxefwOdia5zMT3+8wwYCQmEwdi"
		var_s1 = var_s1 + "4vQKqHKvigKHoKnc9Rs7GMDUOhhGOnAYjWkzKKRGyxsDUA01QCw0QCOF0uh0OkfRUMMbyRNwTBiCYZwKMIYyZAUkSlBYkxsCYAAHG4qwCBwMQfBYlxsNgsDhLEgwHA8P"
		var_s1 = var_s1 + "iPNg1ygP4uywIgMSwK4zSQG46BnFAATDJcL3IHM6DQBsPR3O83j/AsJyGH8w4ZJY5TsN8EAdFojTwJ0AAoA4MgATIMDqAcrQPMEwTDBgVy0LYtiuK8qyrFs6QtCocnLC"
		var_s1 = var_s1 + "s8wAGAChOGM+CZJ0HAaoQHQYocBiaHtJT3LEfgCLYIgQNYgw4IQiSaBcAABBEAB/DAXS4HgPAgLUSCzGkPjkIATyXPQoCeNYfR6Do7QGI8Zj+CAHiyCY2SkIQTSSCIyD"
		var_s1 = var_s1 + "QCkpDBJQJinMMuAUPgOxGOcpA/AkoTzJwyiYFMiDwJEsShFAURFCwJRVFceQXKQIS8P8STlBgLggAcrAQCQATjIgZA0JgVSxL0OAmKI6CpEc4SuOkeBeOwMRnLQuQhOA"
		var_s1 = var_s1 + "pDJAImYmD44BPIgAzFMYiR3LcQw4JwqhQAknAMFAxwEEwJwUO4ljCHgmxzNwNQ3EU3ScLYEAACocDePwZgCLI+yFN8jg7FEQTtKMcwrAAOhgHw6SQI4OCmJgjDmNAjj5"
		var_s1 = var_s1 + "Gw+wbHkkTpEw7gpFgIAA2sABJEUThEK4QhgIJAQ==`)"
		.CellPicture(0,0) = thisform.Gantt1.ExecuteTemplate(var_s1)
		.DefaultItem = h
		.CellCaption(0,1) = .CellCaption(h,0)
		.DefaultItem = h
		.CellHAlignment(0,1) = 2
		.DefaultItem = h
		.CellImage(0,1) = .CellImage(h,0)
		.DefaultItem = h
		.CellImages(0,1) = "2,1"
		.DefaultItem = h
		.CellPicture(0,1) = .CellPicture(h,0)
		h = .AddItem("<b>HTML</b> <off 4>Caption")
		.DefaultItem = h
		.CellCaptionFormat(0,0) = 1
		.DefaultItem = h
		.CellImage(0,0) = 2
		.DefaultItem = h
		.CellImages(0,0) = "1,2"
		.DefaultItem = h
		var_s2 = "loadpicture(`gCJKBOI4NBQaBQAhQNJJIIhShQAEEREAIA0ROZ6PT0hQKYZpIZDKBJkIgKByN5mNJsMsKPABVqXBI4KjrD7HL6GWKPJKiCIhMiySidKxbOzZZJWMLsG"
		var_s2 = var_s2 + "L2FqyLjZMonNa2CyiZDOUqsQqUEq0ZCNISFXDIFxzZ4hUrbdrefZ/fz3ZgzZ75Tz3XjvHZnZznPieb55AKgAqmRyOOzEhR7XirWaWQQMTa+QIhDbZOZAAoYUCPDAQG7F"
		var_s2 = var_s2 + "XI4JRrNCoIRdPyyFr0AYifDUKZ+PCufK4RReALLUbtdBHSrGTCCNKqT4MbRqUxxQx+CAAEQ2VCBbxqGaLYDZNgzFbCbLDarRCrqMYMM6cWqpHKUDqhZjnVijEoLcp0FC"
		var_s2 = var_s2 + "jVg2OYhTjN/QWk4bo4iseBsAcABIDoPA5g2HgADIkQfDCNxwkEQYnFmAIAB4OJHGcKAPioGRKFKdh2g6UB8iiZ5QkYQp3gKWhDlsWYmAARBcgCIAUniVpmiSA5AF3A4w"
		var_s2 = var_s2 + "G8P41nGWwDDAW4MAAIpSG+bRzBoGx3AeCJhh6C4ljCUJGnSRBUFKAIQA6EgIHMWBoHqYgAngHJDCALBmhCCAfHOARAScUBvAmc5zHYXxoguXQ8DEMIAH8dI8HmP4/AyQ"
		var_s2 = var_s2 + "JAEAYAoHqRByEQGJiECBAzAkKIpBYNIcikAp8kcZhDn4EBChmUoMgqHIqhiWoIgaDImgyVQImaRw/F0EZGCcSw3DaM4Kn6GBBhwYYZDGZo3C+RgOAmNQnhYeYqgsTZen"
		var_s2 = var_s2 + "EVgSFYLo2CydhGg4OROF2HJjlydR7i+cJjDGFo8BgHgVl4Po+DufJRgcbQOlkCxyKuCJNAsdwIhSC4mgieYKkeHJWD0Ih8BQaYYkkMYppwTg0EsFhJC0SxEkgeodDSFp"
		var_s2 = var_s2 + "TheV5SDgLBIieRIigyVo5CeOpymoWhtEQfRACMR4zE2KxRnsV5dF2ehFCeC50G+GBkBiZgaCUGYnBySY+BsdIuEkJJJDSSRsjGeYqEWOhliYVYOHWDYbFuNhFmcS5siq"
		var_s2 = var_s2 + "bZrnGLYOh0DpPhyXo7D8d4ZHGXR1CcdRAnsMh7GELwIHiSx7CiXY0HYNZ1nOcoPg0SB+CWLwwGqUpbFAQJwEeEImlCVQwk4cJxAiFRIhMS4ulGYRRlmMQVDEHZxG8YxX"
		var_s2 = var_s2 + "hIaQSniLhIiaGwnDiJZGicZYnjeZw8D6OoSkWEIthwI4emudwtGwepNhuLQ3F8Zojm4bQrhALo0D0HZwCcJwoimeI0ASWR6CAJkJQORfAiFcLIXgahaiGCgMsKIpw8DP"
		var_s2 = var_s2 + "H8H4Pj2BhjrBMGQGYfxFjuEGIsB4rxbg+DSFsPAxBtChHoAQaYmRojVG0D0e6JALjVD2K0F4qxfjjGyPIRY/QXi1AOAILwFQGgOF8KYDwOgdBsHmCYcobRtjIHoGgZAm"
		var_s2 = var_s2 + "Bgi7HgPcWoHxTAmCQCcVwTgDB+FYJgfQMAOj0F2PoZgkRMjeKQLkWATwdDzEkPMF4FxzAXDGJYfAlgPAuB+FkeIWxuizC0LkUwvQbD9ByHIDouxvBCBgCMCAvh4CXCME"
		var_s2 = var_s2 + "gSA0BJDEH+AsfwMgfjhDeL0Ro/xkgvH4JMXA7RYjyAONgPAWhfjyCuBEcAFRSAWE4BIOwEAUgTCaIYfA4wSBUAcAsDowQOBFA4J0Hg9h2B4EmCQTYVBdB0FwIwU4rByj"
		var_s2 = var_s2 + "JGmHIRQ8gJAKB4IoZgShaDKAQOUIolQkjVBuGoSw6hugaFaJoeoWgajaDKDoO4dB5j0FcJ0Zw1Ang3CQDEdgNQnA6EmHgGw4QuCiCSAKFIXBgilEwGcLAZAtDmC0N0Wg"
		var_s2 = var_s2 + "LhaApFiK0HgfxniuGKP4GIvhrhhGgHEZgaRtB5GSBUcIhg5BnHkOAeQFB5A6DiEEao2xoDHH0KIQ4bxYBfFEP8RogB5BfA8AQHwvwqAZBIBURgCgwgPAqAkKYCgfgTHC"
		var_s2 = var_s2 + "BwDIegcgjFUDQXQPQzA4DsCkDwnRABNAwE8OgTw5C6AkJEPgPRSg+DqCANoMRBjuHUKEJglQWDrHYOATg3BuDGDWEMa4CQbj3HMB0Z4Pw5jLFuCAWYsB/D2DgBEUQmB1"
		var_s2 = var_s2 + "iuDEMkfI0hUCyEkPIfwihKgqGsGobIGhNhfFGGoZY6gDDuGWDceANA1A2DyDUM4txaA/EwG0bo0wTDXEcH8Sg/BcD2GSHQC4pgtiuGOOkNIRg3hbG+MIGYjhzgaBeHwL"
		var_s2 = var_s2 + "4FgHAMAYFIfgJh4nJBQGkfAwRNiFAiO4KIlhoiKFiOoO4EwPiYGONUE4RATg6BOMcUwEApgZGmP4X4lxnjYGaLIZg7RNirH6FQG47xZCAC6OQLK5B1BYF8LgOQZAqh0F"
		var_s2 = var_s2 + "qGcBo/xMhpE6HsXomQwBKCwIcfA6w/DxA+IURAIxwgmBSCMKoJgOhFD0JMeIkQdhREwFAEQKRFioAYKkJIqQlhpBYFEPYUQui0GCGgFI9BlCOAUDoS4nRhA7HOOkFYdg"
		var_s2 = var_s2 + "uhgEgGYUgZB2DeE6IIYIMQEgyAiPYHgYgnBlFiNsPYghKiODqISfddhPgVEOCQE4hg5iWHWPEfwfB3BgFYPkAIWQPAOC8BIb1MwrD+QsNEQ43ACAMAKGUQgsBhBoHCGU"
		var_s2 = var_s2 + "SNrxBBoEqNgGo8QMAJF+MMOwRxGCOFUBwHYdhODvDwMEBILgk21AKKkOI6RrgyD6LIDoJxNjkDUOQF4yAXgoC4FMXgqhKCiE4KACQow9D5CoJgLQiA9CwEMLUYwOxmhA"
		var_s2 = var_s2 + "FaEAdoSwdBBF0CEPQEWWDrGOBoEgGhTAaDyBsPoNgXA4CmHIWw+guCDCSJsNIjxsgADcNQPg2hxC2FKLACo2hNDFEMMcKw/BeCcE6LYXoGRvDJGCN8GIxgUjYAyOUbg6"
		var_s2 = var_s2 + "BpDrB0OYWw5AgjtGSOoEofAgjRG2NgY4+RRCfBeKUN4qQvi7H+HAYAchwCOCWAcQQZBBFiG4EIUYww3CFFuEQSgRAlBdDMIwCQiRrCMGCMcIwxhuiKDeE0PAlxCC8GFZ"
		var_s2 = var_s2 + "QS4YhIgaEkJYS43hLAxE8EkTodQUBbBWMcHoNxy0lHqOETYyAeDeD4I0AQlRhD0G2E0O4PgKCjHeEoSgmBKCGEsBUS4vxUA8C6M0K4ox7irD+O0VouhfD7FUA33I+gmi"
		var_s2 = var_s2 + "XE0IsLY1gtipG0CQbQLQPjFDuDQHw2RtjFGsK0bw4x9j0CcO8N4/RtBnhSgvAcBehmAOh0ANgiAhAnhih8gwh1gbhugRhSBRhDhjh2Bvgyhfh3gPhThOBIBOA6B9gsAY"
		var_s2 = var_s2 + "Aah+BdhlBWBtAuBoBThtB8gnhFheAlhcByh6BKhvAahNBnh5B1gJB1g+hCAsgAAbB1gOguAJhIAoAmhFBvqzACABh0BlgFggA6CaBvBQA7BDEHAaA0AABoAcgGBEACg5"
		var_s2 = var_s2 + "AAgYgZgLAIBKgFBBhWh9AggCAIBoBNgAANA9AJhwABBxBwAKAYAAALCJu9ADAYAFBLExBEAiBEgmBEgxBEANBENbhmgJh5gJBNgJgzgJBfgRAvAhpKhnAQg5AIpkARAS"
		var_s2 = var_s2 + "A/ASKGAPBJhZBIAdBJAbARh7n4BIhshkAnAZDVgkBZAUg5AWh5AVB5AEgFAbBFA4BFACglA5hlAfAVAChVAtBVAig1AQh1ABBNB+gaAcgUA7AqAbAWgTg2gfB2gSB9AI"
		var_s2 = var_s2 + "BdA1BDh2BHAnBdAZg6Apgdh+h0g7lCBoAXh3BJBugahkBwBihkBkAsBYgtg/h7gNATBNgkhIgUhBg0gzI6BZgJRJglhvAvARgrAtBrALBbBFh2BxB2BZh9hFAcgOAcAd"
		var_s2 = var_s2 + "AcgCgcBzhcAVB7h9g5BlgxhohsArgDh5A8heA8BKh8hMB8gzB8APgPBmAdByAShQAVgUAWMMAaAThuATgpAWhNASgLARB3ASAwg+AsEwhiAoimBTBxhUAJhEAJhVhJBP"
		var_s2 = var_s2 + "hSBTBSBjgyhvBPlWAbgUgfhRhYBUAkAoBTAoBQgrgygfyhgTBShXBSgwhUh0hWgKhTguhQBphRAdhWAjhoBvg1gQA0g0A1AKACAehLgegzgrgmhcAmBahmB+A4AihzAh"
		var_s2 = var_s2 + "hLA6ArAFBrAfAbAyhbAPh2hYB7BzB8AOBDgwhTg+hnALAXB8hXBph3AxAPA/BPA2gLg7A8hxg+AlAXANB9ARB+A6B+h5gBgEBAg9BLhFBBAUghAWAhANhhhsgRgBARBv"
		var_s2 = var_s2 + "gjAUgiALhjBpBig8hjhHgSA1ASBqgvA4gkhzAmgkglhRgnB7hlh8BKA0hNgxhMBtg7guh5gjAzhPAtB/BJgBBmhhBvAdhDAighg7g2glAzBlg+AVhUAVAphVAHhqURAG"
		var_s2 = var_s2 + "hvh7g0AgAahvA2FigMg2BhhaBrg6AMAegTA6AVi5B6BlgehNgMgoA9gigMAZA/hBgMgGg+hfgbAvAegSgbApgegXhZhqBagzBYgogfgwB/Cwg7hgh/hDA/gTg5B+gNh/"
		var_s2 = var_s2 + "gXh6B8hbh8B/hEhfASg2h/BHh6BfhZBbhuAjB/g9h7BbBth0h/gbh2Ayh/hAh+h/gnh/Ajh3AwgnA/gigPBzBPBVBegigfA1h8BPhshr1HgNhvAxB/hoBdgGgBhZh3sU"
		var_s2 = var_s2 + "hMh0gmh1hLg9hIgchQB7BthugQh5hbgugth6BTgLi/ALBkocoPgCA/BQBfhmh+hXhzA/hzh+g7B1hbgch/heh4gvhEg3hsBfBOgbA2B9ArhrANhPTSKXAMg7A+Bhh4Af"
		var_s2 = var_s2 + "gZh/AVhdg/hzB7BTBsgfh5B+gdhZh/g7oQBogSh/BMrPhUhYBshvheBfA9AThph7ANhvhNgog/hZBNg/hdhvgIAxhjB2hHBhhOBtg1gPBCg3hZBDAmhDg0gfhNhAg8xM"
		var_s2 = var_s2 + "hgBiBvkig7BGgKBHBDBfBJhDBWhPg6BPxKAvBOBUhPB5hMhLhAh0mXBXAFhhB/A3hXBIhwB9AAgUBKg4AHA8AMgdgDhuB8hGghhcACgUAAgOA4AAA8AQABh2BQAegHA2"
		var_s2 = var_s2 + "BOB9BYhxhrBAA/hfg7hah4BCBrAxgABkAdAcK4BtgsAshdhZCSAVglgFgbASgeB3AQAPhNhIFJ2TBnhahchDBBh9gQBogABSAlhhBUgbBLANBvA+hbh+gAgWBzB5BXBW"
		var_s2 = var_s2 + "hFh/knAAADgLAkgiAggqAsAEhigrA1g2AKAqgKBfAZgdh9g2BbhugjhUgCgtgBALAtAYy+AWhEgmgAhFgSAaT4gAASgaATAahIgxACB9ghhGgfgmBoAEB4gIg/ANBagx"
		var_s2 = var_s2 + "AkhGBRA0gs3yBaBjTNAFBCBFBghCACAJAlhFh+AAAEgCAQgQg+h2g7Bbhdgdgdhdhxh7gGvUhbBHhah/B5ATAzh3BOtAWchuh3hOA9h3XvAfgbh0hfh8Brg6hegDB9Bt"
		var_s2 = var_s2 + "nWDQByA4gkAGJIAZAEgcgFh8gvBJBSAdh0BLhqBLACAABHBtgwB2x8yngsg+gAByA2gAB8hxhvh6Byg+AFBp4nBShMgmBzANgAB8ACBZADARBLPVhQh7uKBOg/B7hqBU"
		var_s2 = var_s2 + "gphbA+AfALAygQYohXBZi2AThYhcAeBPhAuwhdgIBEgiB7B9YzhDA0AvAthIBAg8AeBfApAohKA/B2BRA+BYm/gGBCguAG5JhAhjZLAgAvgvhPg1gYgehmAbgLZQhDAj"
		var_s2 = var_s2 + "AjgjgOh5heAxzgABhx5Wgig0AfgQA/B13iBgBchVgrhXgVXFhbh9gKBdgugUAbXDgygsg+A/B+B8AqA6g6hahbBsANBmA/hCgmhegeSVgeADBwB+BKg+BnA0hwBxBihF"
		var_s2 = var_s2 + "h7BxBxAxAIgGACAiAYAMAKA/BPgnguAMgPBbBngak8B+hsgqAVBag2hnBOAoBWAJhYgsA2AchvAHhIEMAmgmAmAkAjhHgPB6hUBkhSAqApgpjehsBcgZhAhuAYBOBdAu"
		var_s2 = var_s2 + "AXAwgpgPBMBwAOB5AjB+AeAYBwANACghgnBTgph3h0B0BMB4h91BgMAJhxAmgSByhshbajBaWPgTgCAYA4ACWGg3g/AyBfgzhnhPBxA1hrhXBshehChChRBQBQAgAeAF"
		var_s2 = var_s2 + "BNAtg7h3hHB7h7B7A9BOgHBDgggfhrBEBHA+h9gRB+68hPAfg3huAoAzbAAiAGBZA7B2htAqB7hYgxgwhVgehOVIFFBRgchLhhgAA7BfBthdB9hkhkgkg0hyBlAKhBg3"
		var_s2 = var_s2 + "ABAgAZBEg4AcBWAGYIhzgXAEgDA6gmhphwAtgRBYBmBwBwBQAThBA3gvBXn3hrBDBuBcA/BugnANgEBLhKhCgzhwYzhAAiARAohGgHgggJgMg9gMBrA4g+A6BoAUhchu"
		var_s2 = var_s2 + "g3BBgAhZAIBPBNApAFAFAFh6hZBZAZAWhMgkAkBEgyApb1BOAqBGBIBmATAShAhsgOgHBuhxh4gsBOhph2ArAfBmBLCWgigxgOhZhshtAMBrghhDgHgjgfrIB5ABBCBQ"
		var_s2 = var_s2 + "AcAgV4gPhcgIBWhVhXgnhBApA4hVBXhngFhTLMgcgOhRgtAMh+hFh2h2gohnAsgshCg+rTAGgNhcgjgvwhAsA0BOA8gV4dBN8qBJh68rgUgoB2BdA6h5hTABhMgWAxhT"
		var_s2 = var_s2 + "g9A2guguhJBDB0g4B5hzBmsvhwgwgzgog4g4gDAmAygPBUhWAqANgbg3AmBAI2AOBzhDA8hmBKgxBIAFgAAJhbCuhGgKl7BwhwAmgcAKAigDh2gZAJArABANgDBegx5W"
		var_s2 = var_s2 + "gZADgwBGBEAkBegAg2AYg9gwKABtBmhPABBoBZAPgFhHBMAPhmB/B6bdhZhdhdhth1hh8lBGgIBEAUgOhEgKgVgrA0AngaAaBiBIgyB5A3gLgXBcAEhlJjAJgEAsAJAk"
		var_s2 = var_s2 + "gqqlhththThrhrhrBVBTAWhZhDhPhThIBWARg+Bn7Sg7A3gDhZAvAphEgegGgehuhpAJAyAJBZQ9gBggAAgAgwBDg3BCAAhkgTh0hkAAhLhthWhTgqAqhJBIAhhmAEgq"
		var_s2 = var_s2 + "gqgCgbBiB6h9BD8zhxhmABrOhfAqhMg7ghwiA4BSJNhMgqg4BEhkY8AjBphNATBaA6AtAwBYgEACBBiEBABIAggbg7gmh1AlglAlgahXBmhmB1BgBPBEAmAnwZgogyhV"
		var_s2 = var_s2 + "gmgABcgxsNBUAWAAB2B4AHBvA5h3B3ggAQBIAwg+hPhSgqBQCEA/gQBQA2htKUgfAJhFgkhkAYBtAIAMHpgbAasHg0gVAsBhhIgbBVAxAi/MgFBnAZBDBpB2ABgwADBW"
		var_s2 = var_s2 + "h3gchuBwBxhrhkB1BbhWAFAP5mBCghgTgnA8AgBV+OgqhSg2g1g3AnBOAcg+hNAYgbhHBRg8g6BjhjhjA2ADgdAdhTg/Aeg/hvA6h1h7A2gChLhKfjAdAxhahigYgMAG"
		var_s2 = var_s2 + "Ashzg5AAaYh/AGAjh2AChABwBOgwXnBFh/ApAzgT2GBZBGvTBHAjBGhAF0wAgsDi1w4Nza2UkyBUYiA+maxm6g1K32ad3s2Qg8AKlRaBlKD1wKE+rCCjSObAK8iGsFOr"
		var_s2 = var_s2 + "C0vR0lTeDV8IUatHu6GO2jkAHgAwgfgC5TYrVsKk2Y3MBRcpBQkgmOUuznY2FqKy0WSymXeX0ASwel0olHI5AwJ1mx0gL1mTXU6XS8Vpdj4hyg8BemDYZHqMFOUyYZTW"
		var_s2 = var_s2 + "P1WJ1CN1MTR6gH4cmysjKr2mlCqn3GuR+jDoJHGWlKkU+ajXpgg1yq2FQDFigSEBROwkCKnQwGwjliIU45x2HGyIB4dnM0UmUC+PhaLxefwOdia5zMT3+8wwYCQmEwdi"
		var_s2 = var_s2 + "4vQKqHKvigKHoKnc9Rs7GMDUOhhGOnAYjWkzKKRGyxsDUA01QCw0QCOF0uh0OkfRUMMbyRNwTBiCYZwKMIYyZAUkSlBYkxsCYAAHG4qwCBwMQfBYlxsNgsDhLEgwHA8P"
		var_s2 = var_s2 + "iPNg1ygP4uywIgMSwK4zSQG46BnFAATDJcL3IHM6DQBsPR3O83j/AsJyGH8w4ZJY5TsN8EAdFojTwJ0AAoA4MgATIMDqAcrQPMEwTDBgVy0LYtiuK8qyrFs6QtCocnLC"
		var_s2 = var_s2 + "s8wAGAChOGM+CZJ0HAaoQHQYocBiaHtJT3LEfgCLYIgQNYgw4IQiSaBcAABBEAB/DAXS4HgPAgLUSCzGkPjkIATyXPQoCeNYfR6Do7QGI8Zj+CAHiyCY2SkIQTSSCIyD"
		var_s2 = var_s2 + "QCkpDBJQJinMMuAUPgOxGOcpA/AkoTzJwyiYFMiDwJEsShFAURFCwJRVFceQXKQIS8P8STlBgLggAcrAQCQATjIgZA0JgVSxL0OAmKI6CpEc4SuOkeBeOwMRnLQuQhOA"
		var_s2 = var_s2 + "pDJAImYmD44BPIgAzFMYiR3LcQw4JwqhQAknAMFAxwEEwJwUO4ljCHgmxzNwNQ3EU3ScLYEAACocDePwZgCLI+yFN8jg7FEQTtKMcwrAAOhgHw6SQI4OCmJgjDmNAjj5"
		var_s2 = var_s2 + "Gw+wbHkkTpEw7gpFgIAA2sABJEUThEK4QhgIJAQ==`)"
		.CellPicture(0,0) = thisform.Gantt1.ExecuteTemplate(var_s2)
		.DefaultItem = h
		.CellCaption(0,1) = .CellCaption(h,0)
		.DefaultItem = h
		.CellCaptionFormat(0,1) = 1
		.DefaultItem = h
		.CellHAlignment(0,1) = 2
		.DefaultItem = h
		.CellImage(0,1) = .CellImage(h,0)
		.DefaultItem = h
		.CellImages(0,1) = "2,1"
		.DefaultItem = h
		.CellPicture(0,1) = .CellPicture(h,0)
	endwith
	.EndUpdate
endwith
|
|
988
|
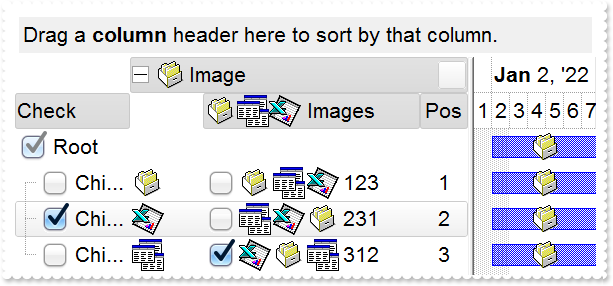
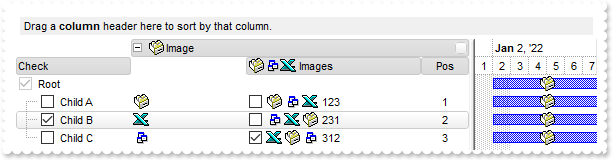
ImageSize property on 32 (specifies the size of control' icons/images/check-boxes/radio-buttons)
*** AddColumn event - Fired after a new column has been added. ***
LPARAMETERS Column
	*** Column.Def(48) = 2
	*** Column.Def(49) = 2

*** AddItem event - Occurs after a new Item has been inserted to Items collection. ***
LPARAMETERS Item
	with thisform.Gantt1
		.Items.AddBar(Item,"Task",{^2022-1-2},{^2022-1-8},Null,"<img>1</img>")
	endwith

with thisform.Gantt1
	.BeginUpdate
	.ImageSize = 32
	.DefaultItemHeight = 36
	.HeaderHeight = .DefaultItemHeight
	.SortBarHeight = .DefaultItemHeight
	.Font.Size = 16
	.FilterBarFont.Size = thisform.Gantt1.Font.Size
	.ToolTipFont.Size = thisform.Gantt1.Font.Size
	.Indent = 26
	with .Chart
		.FirstVisibleDate = {^2022-1-1}
		.Bars.Item("Task").Height = 22
	endwith
	var_s = "gBJJgBAIDAAEg4AEEKAD/hz/EMNh8TIRNGwAjEZAEXjAojKAjMLjABhkaABAk0plUrlktl0vmExmUzmk1m03nE5nU7nk9miAoE+oVDolFo1HpFJpU5h8Sf9OqFNqUOqN"
	var_s = var_s + "UqdPq9VrFWrlbr1QpdhAFAkFis1ntFptVrtkrpszrNvmVxqk3uVtm1kmF3sdBvF/wGBmV+j9BYGHwWJulfxdax2NyFdx2JlV6l9Nw7AAGZymdz2Cy2GxErvWcz9ivlwy"
	var_s = var_s + "V21cuxugwktzGIzmvwtl0+53U5y0a0Wazmmyu/3dCyOMyXHx/J5nIr9q3uyqnBxFN3G46ma4vb7mD2Ng4nZze00fDkHC7t7us2rOX5tguetpHRlmz4HVqnXk1PjHO+CM"
	var_s = var_s + "Po9MBMC+j2vC8j7wS8cFNI4kBo05UIvfCT/NsnsApU+0Fqg/T+oy/kPxC0sEQfErKQK96+w28UWRI8UGvO8sTLS9r2PWmsMJTDTask3CsIbIEQRA3shOXEEAO/GclJ9F"
	var_s = var_s + "EKrrA8FRbKMXRIlb0JxCkjS1LMswhCcvuel0cv26cSMa8Ufx+2sQwhEUoSXOCjSbLcnxjKc7sdKUVyq28NtVI71P9P7JxtQEapjQ6fzfM8zPfNE2PhIsLL63E40slk5y"
	var_s = var_s + "7N89LcyU9SvMb3SdUc6VJLj5VLVLfO/PS9KzNFHUa/0XyBD0dxlS9cxhMlTRSoNXypPErWDPyfNS+MwprRNO0FD8wVVZ1AI08URwVRjtJ1WCn21QkkUrXVLVPQS/XIkF"
	var_s = var_s + "gTxT9iONZ9xVTdq+L1eKg3kkF6Upe68XtfV51/MtrVjBlwYFL1ev8y1/P6/lyzzYl02wntj0RVFmS1Qa+M5as93QxEUW9e993rfmQ2+vy65M/mL1lhl/2bj2ByVduMtN"
	var_s = var_s + "hCJT9hdz41nN14Ld12Z9UjfI/oUAaGseiw6+uFLLhcVabJOS5RqOE0BHlZ5VnEr5fOMs3st+aa/bbRzrJGV51Y0b0DbqaWXZD90hIsPbjWu52+6Wyadpe66hhO+P/Xio"
	var_s = var_s + "W5rD8ZbrUZuVg6n1dsE/cXmewu1m9PVwnd35/nueXho/NaJzmjc61W76esuT77eG8pTquy9TwWH8LEzG8RDfFalx3Gcfvna9rvG/cptGLd9tuI6TZOP5Fiqi99vea+X4"
	var_s = var_s + "VRcBq/JZZtVQ9cwSs5lsXE372+a9z7PbfB3VVqHyvMctLto8uob6eV0m/cD6MN2v+T33t6sBut42vdv2bJ8a997x2maFJfK+qArbGJPEKE+1qTflMsIdW/GCJX17KcT6"
	var_s = var_s + "/czr/X+u1g29B7j/4BQfWkkx4zIHisjhPCmE0K4SwtXM+d4BvHRwNZOoBph9IJvPek9d40FoMJxf691jj2ywQQcHEWET4XJwkTszlVqm2GokewxtBT1DpQjRxDN0rUVD"
	var_s = var_s + "NKdC3lb6tzNOwh6upMSSYfv4YBCl/bsn9PxiFCEo7SI6Obc9HeOrnY8x4jtHtdpN4GRbaorhsbu18Pph5CiHymI0RpSXGJ/z2oUOxYxG858AyiI+bfJtuTcG5yelBJyT"
	var_s = var_s + "8okhqFd4a5yxL0rvulYtKCsZiWxWkc1s1cRoxxwhA31DLE0mR9l9HqX8fJgTDmFMVH0MIsRzVYnwnMi1dyzmhLt2kS2pxIiU62Wj5ptQGlSYFakLonTUJNLKaM5Wzlff"
	var_s = var_s + "EkuFkk5wTrhVO2eE7G6lJhxFFYUZ55zmn0WuBCD4pzhirFCKkbomsOoIYmZx5p90LoYWGPdD5g0QmJRKYxbZ6zYoVQ2jVGylSak7KSkFH6RSjpHKFuU+YMyNo5SulkC6"
	var_s = var_s + "I0vonTCitMXPoEpVS2H5FQfEqp2R1opIgAEkJISYARTCukOhmPNI5Ex/wzGHUsicMwA1LHgQ90Y/KpoQHAD+pB/R4NzIaMAB9Xaw1gqaAOsh/A/ptIkWUfhGK1kZH8Rg"
	var_s = var_s + "H5GqvgArqRmt4AAPrTroRofBGADkqr6Rmu4D7CEaHARiwpJrEEZsXXwlVjyMWRsaRqwdkLGNBABZmytmyMnaINZqyVpLR2ftKAAAdd6h2osbaskdiq4EZtgSmyNcbVWR"
	var_s = var_s + "JNXe3AA7REar3b0stlAAXBtoRmvJGLjEYAHUWsFcwCD/rnaop9aEICMAPdK5hT6xpeuzdOtAgKuJeGfdq6ggEbkTvAP+p9UCHXrvKkcgIA=="
	.Images(var_s)
	with .VisualAppearance
		var_s1 = "gBFLBCJwBAEHhEJAAEhABfICg6AADACAxRDgMQBQKAAzQFAYbhkGCGAAGMZxRgmFgAQhFcZQSKUOQTDKMIziaQAGgkNQwCSLIwjNIsBxPFKVQChEYxSjKA40SJNUgyj6"
		var_s1 = var_s1 + "CCY+QLIE5PfQgAL9I6eJABCCSQKkYx0HScRiwPBIbAZAYhCZqaKhWgkKI/WBQIABRDVLx5ESiLRtKy7Mq2bpvXBcNxXHalaztO68LxvKyqHb5fJ/PpgL4YHgmC4NQ7EM"
		var_s1 = var_s1 + "RwF6rfbyfZ7Xg/ORPTijZ4sdzMHTzJyscx3HqfaBoOaZU5eMLceTUMofHIndxCcasPbsOatVqjG5sYjcGC3La9cz3Pq/bpuDCbMxuaK1TrYXr1TTrcofBDldAxXRKDxR"
		var_s1 = var_s1 + "DWVhLnYOw9i6XxzjuXprCaOoKB6EwbiCZZCGOdZYlcT4xHmbhMnwNxtn+G5bmqdZ7n4Pw/i+X5zm+dQ9g4CAFjsfAJheOI8HsDoWDWTB/lwSAQkmA5PEgRYoDyDwYFYF"
		var_s1 = var_s1 + "oFmGCBmBqBphDgRJ0gOTIYBGRB/lyRh0iSCZbjYWJzgWDwIjYLoLmMCJGDKDJjBgWgqG6YhyhGHRzA2aJ1mCABOAiOJvhCZBJBYRoRmSCQmEqEQimkAZgg8TZnDCV4Uk"
		var_s1 = var_s1 + "mCUmBKZYJGYWoWCUUhiFMNZckNUh2GENoaGaGZmgmJhqhqZpGGIEx2GYIxSGGGJdggWJth2Z4JmYeoemeSZ2H6H4hGmQhihyTRHGYLg7CiCgmgqIpokoNoOiOaJ4jqAo"
		var_s1 = var_s1 + "chqaZGgaCxpAoZoaiaaJqEmWIcGgShcnCJwqEqFoR3YOoFlgchflqNouiuawHmWSYqGkWZQhcatzmaOoumuSp2j6L5bBaKo0GQKRnGGCxqiyCwmkqMpsksNpOGUGI7A0"
		var_s1 = var_s1 + "ew1G0Rxlg0PptgsZuDG2Sx2l6N5tnYNZZjUDRXDCVo5l2FoymqOpukuNpujubwLjmWY5k0ZwxkaFxYlWdp6j6b5Lnafo/nABQdg2FxcUsY5BkmXAkmeQpckwNRrkKTh8"
		var_s1 = var_s1 + "CSHZBk4NwyC4KxxgMDwakOMZDn8GgwnGAo2C4cwthMcwmCcMoHBMHRehwTIghySYNksZwcH4HBMEsHx5hyPItiweYxnwSZEH4Mozn0fR+DMAo7EYJ50gkdZelKdNql2U"
		var_s1 = var_s1 + "gJn0GIukwH4HicQRai2GI4mSVpNl0dZGledgNgcYpYDWUx3FsOQi5YV5anaTY3G6W53A2RxylydxFjiaxEFCCgBBAQ=="
		.Add(1,var_s1)
		var_s2 = "gBFLBCJwBAEHhEJAAEhABcoFg6AADACAxRDgMQBQKAAzQFAYbhkGCGAAGMZxRgmFgAQhFcZQSKUOQTDKMIziaQAGgkNQwCSLIwjNIsBxPFKVQChEYxSjKA40SJNUgyj6"
		var_s2 = var_s2 + "CCY+QLIE5PfQgAL9I6eJABCCSQKkYx0HScRiwPBIbAZAYhCZqaKhWgkKI/WBQIABRDVLx5ESiLRtKy7Mq2bpvXBcNxXHalaztO68LxvKyqHb5fJ/PpgL4YHgmC4NQ7EM"
		var_s2 = var_s2 + "RwF6rfbyfZ7Xg/ORPTijZ4sdzMHTzJyscx3HqfaBoOaZU5eMLceTUMofHIndxCcasPbsLpOS5LNKsaxmWLYdhFdTxQi6LpvfA8BwXC6JY7heRYRbFbYxRjGNi1TS7G4n"
		var_s2 = var_s2 + "GKd5WGuL4UHwI4VkaYxii8V4pgQMgVBQdQ5iCTYGi8T4vlWbJ3nuPg+l+H5AlSCg6ByPBoE8Ap3jqYxhBido5g0OgOGOGI4CsSpCCAcgcAuEokiEN5NCKfJ9DyTRjnSc"
		var_s2 = var_s2 + "g1CEYxOBmBpPCgagdgcIZoHoGIFA4AxQkCAxKAgKBwgGSpIBCZhjF2E5UnQPQMiMCJBCIBwxkSQgsgo+JtDKT4ziiQw+k6EwAnsOgLnkHI+yCQ4iEuE4klkPhShEJBpA"
		var_s2 = var_s2 + "oPgymOMoaDgHBjFMBgyD0HYTiCZSZhIIIGC4ChiHSew5kwM5omILZPiOBI0hwZw5kodIdA+M4Uj4PxOmMSJ9DuTQzmyZgviceZagaHVfj4awwmaAh2GUIYmCOEZZDaDR"
		var_s2 = var_s2 + "DFGdwcg4EwyHMN4LBOaJbCoaZqgKH8qkMfIyD8DozDyfA7A0Coui0OpMmOZJdCsahKg6NooioChwmEMxLEoXJbDUTRXGSUgykyMgQG0GpPHMdI3D4TRCgSeQ0kmaw+lG"
		var_s2 = var_s2 + "NAtCOZJVCiT5DhyRQwAqMg0EoDBBGEGAsASC5yiSCw+k4Mp6lWNQuksTpRjMTxDGzJwGmGMpDDKXYTECSAxl6Q5olkK4PgMMIVkASRMBMBgzEkaZEjsNALhIZA6AeQBg"
		var_s2 = var_s2 + "k0ZJEgAAJ0CIAgODMNIsD6DRih9uYwFyAwfCUb5ijmbI+gwdxkk8MZMGeMpPCkDxzBiC5MHMPJLDSSROFMLIoBEQogEMFJPnENYQGgE4DCOaJfC7tYkhGTQ0kyWwykuX"
		var_s2 = var_s2 + "pMiyRpKjKR4wngM4JmOWJACCdYtHMWw+Eych4nINYLAEYA8AgdAEEsQZajaQoog4GxPiMVIolcdxNG8XZVkmNoRwWRVBlFeFEeAZQJgnFiHgHwcAhjhHgGMSI5xki2Cy"
		var_s2 = var_s2 + "A4EQsA3i0HkBsLwKRFgAHcPkHopBJBcBeDUYI7xyDOHqKkWo2hLCsDIBIY4qQ5A8DoMMYwOAqCSBGKgU4yB2iDBwIgB4hxQgAAWNgBoAgsBdEcBUQ4sQ9A/HqD0JI8Rp"
		var_s2 = var_s2 + "BzH2OYVgahLBHFiJQJweQiDhDUE4SAARQAzFsG0EQwA6AOWSBkFgVAIBCHeGERQFQiCQHeFkC4vkiB8DyB4F4QxVDvGMNEOQexMjlBeOAKQiQLgfDA7QEAaRiBdEkH8T"
		var_s2 = var_s2 + "I7AZiFBAGYBIABWjYBiGACioQ4C1A+AMMgWhfgxHgPsT4URIB0COKgPgjRwiAB8AYUArxBgCF6J4GY5hrAOCAPAAoGRRCsCIMEXATXfgAF8BMJwURuEQDgD4Q4OBoAeH"
		var_s2 = var_s2 + "GFgLIwQrC2D0JoSQ+QvhrHoSgQI8AbDFGID8C4Ah6BQAQAASACwgCYCMAUMARAvCKAiAMCAokeCKBEOAKgCBoDaHuMsEAqwJDiACDURg8R6gPCyDofYWAhgoDIJ4ZAuh"
		var_s2 = var_s2 + "oiGAYGgRoQw/A0GMMga4GwxiEDeIYYInATCDBQAoBAwAoDlA0KMBoVRGiDGwDQUYIRsgaGGDgM4LAwDWB8EcIA1APhjEgGQVwgRIgjFIIQHokgZA+CSEkLIKQSjHAwMs"
		var_s2 = var_s2 + "CwDAsAEB2ABTIwRwD6A8CMToSxkAxE4HYIw+BsgbBEDAHYBwojCBoIYFgXSjABE4MsHIbQWhlGILQS4UhvBdAUKEEwHgxDAAABQQQUAhgKHiDwE4JS4A7BGLQZwCR4ga"
		var_s2 = var_s2 + "BEMUYAqgKApHgGwVAIRNgvBMMQXImwZDtE4I8UIyAZCDCAE8AwrhgAdEEBACQLRCg4FEB4AYtA7CdEiPQMoJAMDNCkOMCAXAFDhH0D0Q4EgfAaGSK4NYzRUj9BuCgAgs"
		var_s2 = var_s2 + "wOBjB4Fqpw8B2ADAwE4A4Qx2DAE6JIaQPQGhAGKBcIQ5B5gHByKIFARwADbAyKUfgdBKBBGyEcVIAB/ijHoIoSA0gdBNl+OATYERZgBGSDYWIWAUCEGKA4FAhR7CIBtY"
		var_s2 = var_s2 + "QGYZg4CMAiKEcAOwkBjHWE8Z4lQgA+DkBoTohwwCeAaMEEgBQCCABgHMRwQRhhMEWFQd4HwZgwDqFESItAbAGEANCpINAzANCCJkK4ah+heFYBURwsQrS2CsMYMoWGBh"
		var_s2 = var_s2 + "YDWI0EInQgiApXaOVI1QFDsC8MUNoMBMA1HMJga4eh+BeAWOgNNowGjYzCGAAwax+iJBeBVT4gxoBIAGFsJFBxgBiGKFkKQ7g5DFFQEcAo4AzDDACKEQQLgCiJDYB0Mg"
		var_s2 = var_s2 + "RBCCQAgQEA=="
		.Add(2,var_s2)
		var_s3 = "gBFLBCJwBAEHhEJAAEhABQ4Fg6AADACAxRDgMQBQKAAzQFAYbhkGCGAAGMZxRgmFgAQhFcZQSKUOQTDKMIziaQAGgkNQwCSLIwjNIsBxPFKVQChEYxSjKA40SJNUgyj6"
		var_s3 = var_s3 + "CCY+QLIE5PfQgAL9I6eJABCCSQKkYx0HScRiwPBIbAZAYhCZqaKhWgkKI/WBQIABRDVLx5ESiLRtKy7Mq2bpvXBcNxXHalaztO68LxvKyqHb5fJ/PpgL4YHgmC4NQ7EM"
		var_s3 = var_s3 + "RwF6rfbyfZ7Xg/ORPTijZ4sdzMHTzJyscx3HqfaBoOaZU5eMLceTUMofHIndxCcasPbsLpOS5LNKsaxmWLYdhFdTxQi6LpvfA8BwXC6JY7heRYRbFbYxRjGNi1TS7G4n"
		var_s3 = var_s3 + "GKd5WGuL4UHwI4VkaYxii8V4pgQMgVBQdQ5iCTYGi8T4vlWbJ3nuPg+l+H5AlSCg6ByPBoE8Ap3jqYxhBido5g0OgOGOGI4CsSpCCAcgcAuEosiYN5NHMOJ+D4TpTnSe"
		var_s3 = var_s3 + "Q7CEY4uBmBpPhgagdgcIZoHibIEyUBJZDQIJShoCgcCAcoyAQOYYlcZJ1D0DxDCiQgwEiAZMHEMJLFKPJ9D2DoDnidQ4k+Y5QmKEROBkIhKD0JIZDIS4TGUCQuEeEJjn"
		var_s3 = var_s3 + "OIg8CuY4RkYNgwGMM5RllGpThDRYIGKZIpCkJFUH0PINyWcQ3CaaZCG+HBnEOTJhD8Tx4GoeQ/GcaZSHOH5nCmQhshoZhihYYwhiYA4RlkNoNEMUZ3ByDjwEsPxOnMaJ"
		var_s3 = var_s3 + "9DuDR6F6GYmCmKh0nANtMioP4Gg8aoSiIO5NhodociqaY6GaFYkEyOg8lsNRNTaUgykyMgQG0GpPiONJbD8DpDEyfA6k0KwOkWMQsGsAJU0SagwkoJQJDIPISCQCJTGS"
		var_s3 = var_s3 + "UwyGaM4KkmMgtksHpFjAZ4TGCBAbgaSpcksdhNAMIJHHsD5TjSWWMAMOpwjyLwbk6cAz0KRJiDkDYzESCwiggcgcgYIQwCIEINCMCITj6TVxkMXp2j0cQLlCTo7E2F4y"
		var_s3 = var_s3 + "mkMZdhMPJHDGHpLAyVg+k4UwrCCSIyByDJ8DuDY8CiWY0kiXAXC6QJwFKGIjCeJpjgyezjlyDw6klHx5myRoMGwZwbkcToTEiew4kwbQfEmUgPkOKJUD4DpTHSHQmgkX"
		var_s3 = var_s3 + "I/ASTA1g0XIEDMTBimyfI7jSLYHEiUoPk0Fw/kadAsHGao8A0A5smEMJ2mNyg5gzJZwDgCpChyIZVyIZwFCMJEPASRkBqE+IcHInRcDxA2H4bIsx0AtDsIBpwZwYicD6"
		var_s3 = var_s3 + "BscwDwUBgHCIYaIfgtiVH2O4WgUwJjEFeAEQA7y4hMCiBMS4aRdB9A4CYE4LxljyBMHcDItBxinDCLcTYmgejBFQ9UTg9gFBOEmAQTI7A4iZGMGkQAWQ7jYA2HIL8BRA"
		var_s3 = var_s3 + "jDG4HcCwARbjZHiNoDw1nLDnGyNINQ+wjCpBMEgcovQUgICQJEcgWRuBvAyJ4d4ugpCUAINcHogxIgnDiM4N4axzD3F2JMTY/hRqYF6FsWIxhYAGGoAALQYgYirBwBEB"
		var_s3 = var_s3 + "wpAjBEAAIEIYsA2gOHCMAGgXAACIDmMITAUgFABH0D0I4WwvhNFGMAOIvxRD2GKNcMA8gjAPDCPwBogRPAxA8PgRwZRICYDED8RAXQEghEAN8DIgwIBdB4JYWwMgtiQH"
		var_s3 = var_s3 + "oFQKAiRFguFKGwGQhglDsEOVwEQQRkCKBwOIHgSREDRBYHEXQcQdD7GIGARQHRxipBrMobgewDCUCADsEYWAzgMHKHQDQxxsDzA6EMfAeQHB4GQDkUYPA0iECiKoGgRh"
		var_s3 = var_s3 + "cDdA2GMQA8AOCjDSPgHI4QnApAKBICwHg1A+BcAwcYsgbjGGQNkCIgRsA6EcBEWANADjsB0B8YYzQQDIGSBcEYZBCCPEkFIHQSgkgZAwG4IwBAbAYGGAgL4Ch4g8BOCQ"
		var_s3 = var_s3 + "AA2KKC0GcAke4AAXAFCoHkDw4xbBFEcJkE4JRSiEFeJYKQVRMgJHODwX4xAgC/AsIIZAeAHDRG0HYI40RKCLEGDUI4jAghwBWIceA+whCpHMFYZYOQxglDMHMBQGxYjV"
		var_s3 = var_s3 + "HiAoBIPgfgHGwPsHYJRSB6A0IERQLhCjJHMA4OQoAoCOACLYGYSx8DpBQIMWQdRnDRH+DsE4fB3CeAmM67kAAXBFEIDYDI7wLBtEoEIfYNwjiUGGJQYQMAjCHEAO0C4z"
		var_s3 = var_s3 + "xW29CoCgfIxR9AKA6J8BgUAIhDGMIoJ40hqgwCgKETgnBhhqCGI0AIqgZhGDANQDIlBDCRGkCoJISR0g1BSKQOgfAzBRG0DYHARh4DeDAOwANuw8ApCKKkYg/RPhjBsH"
		var_s3 = var_s3 + "0J4yg5hPGWN0GwFBHQBFaDoQIURljFAoB4GgzRVzbBECQFQRQoguHGHANwDRdCKy8CgSIGwhhoDYJYYI1giBICSAEgI="
		.Add(3,var_s3)
		var_s4 = "gBFLBCJwBAEHhEJAAEhABUYCg6AADACAxRDgMQBQKAAzQFAYbhkGCGAAGMZxRgmFgAQhFcZQSKUOQTDKMIziYBYfgkMIgSbJUgDGAkRRdDSOYDmGQYDiCIoRShOMIjHL"
		var_s4 = var_s4 + "UXxtDaIZwhEAoJb+RgAUY/cTzaAEUwHHiTKInaCQShsFYJUJAdRURQ9EwvCIZBpEWwLChENQwWLCNj2TScBwjCyqbale45ViqdoDU5EUiXJJ8ZxnECfYyrGjaMpCeKBU"
		var_s4 = var_s4 + "rGYTVRBIMxLLSia5oeJqMrnBpNVrIUgXCAGFwHK6BcauXIIDp6XoWWRbAAWDpVVzNNC3YzkCIceADHKiXxmVz4JLdGZ1QTGID2XaYaxWK4oZjsVSc4KDHbETbHFi9Fo3"
		var_s4 = var_s4 + "NaaxGisew+GYc4HlCR5NAAAIIEkQJSGMOgdE4RhYDwJJsAaAYQgmPpolCWgSCiBJzjcEIAkQXIBm8d5UhOQgCDUIBDDJDhgggJgKgKYJIDSVoDk8KBFF4OohEMZgWDsY"
		var_s4 = var_s4 + "YDj4GoGmGSB2B6B5iAiBgYDsYRjGSbIJo4RgqDuIpIAoLoLmMCJGDKDJjJiLA7xqUAAgGTwYnYPoPmQCQGEKEJkEkFg9gGY44BoRoSmSSQ2EKEggHgRhShSZRJFYVoVm"
		var_s4 = var_s4 + "WCRmFKFAgGOTheheZgJgYYoYmYSYWGaF4lkMMJ0hqZpJjYbobmcCZGHKHJmjmJh0h2Z4JmYcIaE8WZ2H6H5oAoBoCiCaBKBYfdjGoJoKiKaJKDaDojmkChGgmIgpCoVo"
		var_s4 = var_s4 + "WiWaJZiSd4mmmSh2h6J5qAqBoiiiaY5iSeIpmqComiqKpqkqNouiuah6hqMIsmsSpWiuGhP1kOoumuSp2j6L5sAsBo54gKwWkaMZsgsJpKjKbJLDaRYxYWRpSjSbIZiS"
		var_s4 = var_s4 + "e41m2CxmlqNptksdpejebR5iSfI4m4S4W16boLiaao6m5fJ9jubwLkaco8m8S5WnaPZunuOp4j6b5Lnac4SA0PAGlgP4wEwFwGkGcIMCcCpCnCCxiA8NYAAmMJfkSbhF"
		var_s4 = var_s4 + "CcFpFnGDBnBqRpUhuEwTDeZ5lHCfw6HIQxLCaAxygyJwqgGcATE4FA6hWY4tjEAAQBAgIA=="
		.Add(4,var_s4)
	endwith
	.BackColorHeader = 0x4c6c6c6
	.SelBackColor = 0x4000000
	.SelForeColor = RGB(0,0,1)
	.Object.CheckImage(0) = 16777216
	.Object.CheckImage(1) = 33554432
	.Object.CheckImage(2) = 50331648
	.Object.Background(20) = .SelBackColor
	.Object.Background(21) = .SelForeColor
	.Object.Background(26) = .BackColor
	.Object.Background(27) = .ForeColor
	.Object.Background(32) = -1
	.Object.Background(0) = 0x4000000
	.Object.Background(41) = 0x4010101
	.Object.Background(1) = 0x40000ff
	.HeaderAppearance = 4
	.ShowFocusRect = .F.
	.SortBarVisible = .T.
	.BackColorSortBar = .BackColor
	.BackColorLevelHeader = .BackColor
	.FilterBarDropDownHeight = 1
	with .Columns.Add("Check")
		.Def(0) = .T.
		.PartialCheck = .T.
		.Width = 128
		.DisplayFilterButton = .T.
		.FilterList = 256
	endwith
	with .Columns.Add("Pos")
		.FormatColumn = "1 pos ``"
		.AllowSort = .F.
		.Width = 48
		.AllowSizing = .F.
		.Alignment = 1
		.HeaderAlignment = 1
	endwith
	with .Columns.Add("Image")
		.DisplayFilterButton = .T.
		.FilterList = 8480 && FilterListEnum.exShowExclude Or FilterListEnum.exShowCheckBox Or FilterListEnum.exSortItemsAsc
		.FilterType = 10
		.DisplayExpandButton = .T.
		.ExpandColumns = "1,2,3"
		.Width = 128
		.HeaderImage = 1
	endwith
	with .Columns.Add("Images")
		.Def(0) = .T.
		.Width = 196
		.HTMLCaption = "<img>1</img><img>2</img><img>3</img> Images"
	endwith
	.Columns.Item("Pos").Position = 3
	with .Items
		hR = .AddItem("Root")
		.DefaultItem = hR
		.ItemDivider(0) = 0
		.DefaultItem = hR
		.ItemDividerLine(0) = 0
		h = .InsertItem(hR,Null,"Child A")
		.DefaultItem = h
		.CellImage(0,2) = 1
		.DefaultItem = h
		.CellImages(0,3) = "1,2,3"
		.DefaultItem = h
		.CellCaption(0,3) = "123"
		h = .InsertItem(hR,Null,"Child B")
		.DefaultItem = h
		.CellState(0,0) = 1
		.DefaultItem = h
		.CellImage(0,2) = 3
		.DefaultItem = h
		.CellImages(0,3) = "2,3,1"
		.DefaultItem = h
		.CellCaption(0,3) = "231"
		.DefaultItem = h
		.SelectItem(0) = .T.
		h = .InsertItem(hR,Null,"Child C")
		.DefaultItem = h
		.CellImage(0,2) = 2
		.DefaultItem = h
		.CellState(0,3) = 1
		.DefaultItem = h
		.CellCaption(0,3) = "312"
		.DefaultItem = h
		.CellImages(0,3) = "3,1,2"
		.DefaultItem = hR
		.ExpandItem(0) = .T.
	endwith
	.EndUpdate
endwith
|
|
987
|
ImageSize property on 16 (default) (specifies the size of control' icons/images/check-boxes/radio-buttons)
*** AddColumn event - Fired after a new column has been added. ***
LPARAMETERS Column
	*** Column.Def(48) = 2
	*** Column.Def(49) = 2

*** AddItem event - Occurs after a new Item has been inserted to Items collection. ***
LPARAMETERS Item
	with thisform.Gantt1
		.Items.AddBar(Item,"Task",{^2022-1-2},{^2022-1-8},Null,"<img>1</img>")
	endwith

with thisform.Gantt1
	.BeginUpdate
	.Chart.FirstVisibleDate = {^2022-1-1}
	.ImageSize = 16
	var_s = "gBJJgBAIDAAEg4ACEKAD/hz/EMNh8TIRNGwAjEZAEXjAojJAjMLjABAAgjUYkUnlUrlktl0vmExmUzmk1m03nE5nU7nkrQCAntBoVDolFo1HoM/ADAplLptImdMYFOqd"
	var_s = var_s + "SqlXq1QrVbrlGpVWsFNrNdnNjsk7pQAtNroFnt0sh8Yr9iulTuNxs1Eu8OiT/vsnsNVutXlk/oGGtVKxGLxWNtsZtN8iUYuNvy0Zvd+xNYwdwvl4p870GCqc8vOeuVtt"
	var_s = var_s + "mp1knyOayWVy+WzN/ze1wOElenm+12WUz/Bv2/3UyyWrzeutux2GSyGP2dQ33C1ur3GD3M4zUNzHdlWjq/E3nGzVpjWv4HA7fRy/Tv2IrN8rPW6nZ3ve7mUlfu20Z8ac"
	var_s = var_s + "vQyb+vY9jasYoDwMm+LytVBDqKG3z8O3Cb8P+mkAuY9cCQ2uL4KaxDKvkp8RNLEjqugnrwQo/UWPzFyeQw5sNLZFENrI4kOqU66pw8uzmOKvTqNqjULJvGL1JO48GtTG"
	var_s = var_s + "sbLdEL3scxLlyiw8dQeoUVxdLTtyKmUjwGlslRPJsnK1HbAKbKCrsQo8uQk/CeP44iaR/ATnTNPLvyxPU+z9P9AUDQVBowiofJXQ6Oo+kKMpIkjztE4TKn4P6JowfgPn"
	var_s = var_s + "wD5/nAjB8AOeAPo0eAA1IAFH07UhAIMpYAVIYFHqBUhwVjV1S1EtQAHxW65V0AZwAeuQAnwB5gAPYViEDVhwAHTQBkCjB4gOhwDmCyhH0sACAg=="
	.Images(var_s)
	with .VisualAppearance
		var_s1 = "gBFLBCJwBAEHhEJAAEhABUYCg6AADACAxRDgMQBQKAAzQFAYbhkGCGAAGMZxRgmFgAQhFcZQSKUOQTDKMIziYBYfgkMIgSbJUgDGAkRRdDSOYDmGQYDiCIoRShOMIjHL"
		var_s1 = var_s1 + "UXxtDaIZwhEAoJb+RgAUY/cTzaAEUwHHiTKInaCQShsFYJUJAdRURQ9EwvCIZBpEWwLChENQwWLCNj2TScBwjCyqbale45ViqdoDU5EUiXJJ8ZxnECfYyrGjaMpCeKBU"
		var_s1 = var_s1 + "rGYTVRBIMxLLSia5oeJqMrnBpNVrIUgXCAGFwHK6BcauXIIDp6XoWWRbAAWDpVVzNNC3YzkCIceADHKiXxmVz4JLdGZ1QTGID2XaYaxWK4oZjsVSc4KDHbETbHFi9Fo3"
		var_s1 = var_s1 + "NaaxGisew+GYc4HlCR5NAAAIIEkQJSGMOgdE4RhYDwJJsAaAYQgmPpolCWgSCiBJzjcEIAkQXIBm8d5UhOQgCDUIBDDJDhgggJgKgKYJIDSVoDk8KBFF4OohEMZgWDsY"
		var_s1 = var_s1 + "YDj4GoGmGSB2B6B5iAiBgYDsYRjGSbIJo4RgqDuIpIAoLoLmMCJGDKDJjJiLA7xqUAAgGTwYnYPoPmQCQGEKEJkEkFg9gGY44BoRoSmSSQ2EKEggHgRhShSZRJFYVoVm"
		var_s1 = var_s1 + "WCRmFKFAgGOTheheZgJgYYoYmYSYWGaF4lkMMJ0hqZpJjYbobmcCZGHKHJmjmJh0h2Z4JmYcIaE8WZ2H6H5oAoBoCiCaBKBYfdjGoJoKiKaJKDaDojmkChGgmIgpCoVo"
		var_s1 = var_s1 + "WiWaJZiSd4mmmSh2h6J5qAqBoiiiaY5iSeIpmqComiqKpqkqNouiuah6hqMIsmsSpWiuGhP1kOoumuSp2j6L5sAsBo54gKwWkaMZsgsJpKjKbJLDaRYxYWRpSjSbIZiS"
		var_s1 = var_s1 + "e41m2CxmlqNptksdpejebR5iSfI4m4S4W16boLiaao6m5fJ9jubwLkaco8m8S5WnaPZunuOp4j6b5Lnac4SA0PAGlgP4wEwFwGkGcIMCcCpCnCCxiA8NYAAmMJfkSbhF"
		var_s1 = var_s1 + "CcFpFnGDBnBqRpUhuEwTDeZ5lHCfw6HIQxLCaAxygyJwqgGcATE4FA6hWY4tjEAAQBAgIA=="
		.Add(4,var_s1)
	endwith
	.BackColorHeader = 0x4c6c6c6
	.SelBackColor = 0x4000000
	.SelForeColor = RGB(0,0,1)
	.Object.Background(20) = .SelBackColor
	.Object.Background(21) = .SelForeColor
	.Object.Background(26) = .BackColor
	.Object.Background(27) = .ForeColor
	.Object.Background(32) = -1
	.Object.Background(0) = 0x4000000
	.Object.Background(41) = 0x4010101
	.Object.Background(1) = 0x40000ff
	.HeaderAppearance = 4
	.ShowFocusRect = .F.
	.SortBarVisible = .T.
	.BackColorSortBar = .BackColor
	.BackColorLevelHeader = .BackColor
	.FilterBarDropDownHeight = 1
	with .Columns.Add("Check")
		.Def(0) = .T.
		.PartialCheck = .T.
		.Width = 128
		.DisplayFilterButton = .T.
		.FilterList = 256
	endwith
	with .Columns.Add("Pos")
		.FormatColumn = "1 pos ``"
		.AllowSort = .F.
		.Width = 48
		.AllowSizing = .F.
		.Alignment = 1
		.HeaderAlignment = 1
	endwith
	with .Columns.Add("Image")
		.DisplayFilterButton = .T.
		.FilterList = 8480 && FilterListEnum.exShowExclude Or FilterListEnum.exShowCheckBox Or FilterListEnum.exSortItemsAsc
		.FilterType = 10
		.DisplayExpandButton = .T.
		.ExpandColumns = "1,2,3"
		.Width = 128
		.HeaderImage = 1
	endwith
	with .Columns.Add("Images")
		.Def(0) = .T.
		.Width = 196
		.HTMLCaption = "<img>1</img><img>2</img><img>3</img> Images"
	endwith
	.Columns.Item("Pos").Position = 3
	with .Items
		hR = .AddItem("Root")
		.DefaultItem = hR
		.ItemDivider(0) = 0
		.DefaultItem = hR
		.ItemDividerLine(0) = 0
		h = .InsertItem(hR,Null,"Child A")
		.DefaultItem = h
		.CellImage(0,2) = 1
		.DefaultItem = h
		.CellImages(0,3) = "1,2,3"
		.DefaultItem = h
		.CellCaption(0,3) = "123"
		h = .InsertItem(hR,Null,"Child B")
		.DefaultItem = h
		.CellState(0,0) = 1
		.DefaultItem = h
		.CellImage(0,2) = 3
		.DefaultItem = h
		.CellImages(0,3) = "2,3,1"
		.DefaultItem = h
		.CellCaption(0,3) = "231"
		.DefaultItem = h
		.SelectItem(0) = .T.
		h = .InsertItem(hR,Null,"Child C")
		.DefaultItem = h
		.CellImage(0,2) = 2
		.DefaultItem = h
		.CellState(0,3) = 1
		.DefaultItem = h
		.CellCaption(0,3) = "312"
		.DefaultItem = h
		.CellImages(0,3) = "3,1,2"
		.DefaultItem = hR
		.ExpandItem(0) = .T.
	endwith
	.EndUpdate
endwith
|
|
986
|
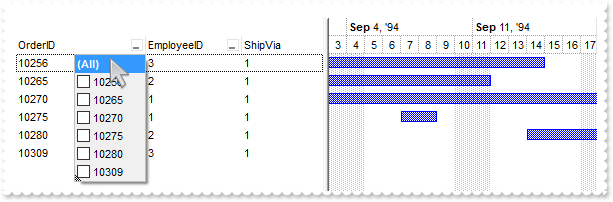
The user clicks the drop-down filter, select a value and the control's list filters for the selected item(s). Is there a way for when the user then goes to the next column to add another filter and the drop down arrow is clicked for the list of values they can filter by to be limited to what is being displayed in the list due to the first filter they set
*** AddColumn event - Fired after a new column has been added. ***
LPARAMETERS Column
	with thisform.Gantt1
		with Column
		endwith
	endwith

*** AddItem event - Occurs after a new Item has been inserted to Items collection. ***
LPARAMETERS Item
	with thisform.Gantt1
		with .Items
			.AddBar(Item,"Task",.CellCaption(Item,2),.CellCaption(Item,4))
		endwith
	endwith

with thisform.Gantt1
	.BeginUpdate
	.ColumnAutoResize = .F.
	rs = CreateObject("ADOR.Recordset")
	with rs
		.Open("Orders","Provider=Microsoft.ACE.OLEDB.12.0;Data Source=C:\Program Files\Exontrol\ExGantt\Sample\Access\sample.accdb",3,3)
	endwith
	.DataSource = rs
	with .Chart
		.FirstVisibleDate = {^1994-8-4}
		.LevelCount = 2
		.PaneWidth(0) = 290
	endwith
	.Columns.Item("ShipVia").Position = 2
	.EndUpdate
endwith
|
|
985
|
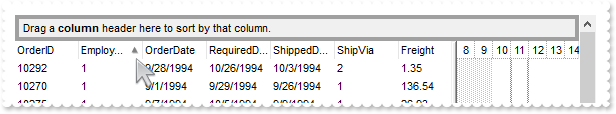
Is it possible to set from code, a column sort without being inserted in the sortbar
with thisform.Gantt1
	.BeginUpdate
	.ColumnAutoResize = .F.
	rs = CreateObject("ADOR.Recordset")
	with rs
		.Open("Orders","Provider=Microsoft.ACE.OLEDB.12.0;Data Source=C:\Program Files\Exontrol\ExGantt\Sample\Access\sample.accdb",1,3)
	endwith
	.DataSource = rs
	.SortBarVisible = .T.
	.Layout = "singlesort="+chr(34)+"C1:1"+chr(34)+""
	.EndUpdate
endwith
|
|
984
|
Is it possible to view all events the control fires
*** AddItem event - Occurs after a new Item has been inserted to Items collection. ***
LPARAMETERS Item
	with thisform.Gantt1
		.Items.AddBar(Item,"Task",{^2017-12-4},{^2017-12-14})
	endwith

*** Event event - Notifies the application once the control fires an event. ***
LPARAMETERS EventID
	with thisform.Gantt1
		DEBUGOUT( .EventParam(-2) )
	endwith

with thisform.Gantt1
	.BeginUpdate
	with .Chart
		.LevelCount = 2
		.FirstVisibleDate = {^2017-12-2}
		.PaneWidth(0) = 256
	endwith
	.Columns.Add("Item").DisplayFilterButton = .T.
	with .Columns.Add("Pos")
		.AllowSizing = .F.
		.AllowSort = .F.
		.Width = 32
		.FormatColumn = "1 apos ``"
		.Position = 0
	endwith
	with .Items
		.AddItem("Item A")
		.AddItem("Item B")
		.AddItem("Item C")
	endwith
	.FilterBarCaption = "`<r>` + value"
	.FilterBarPromptVisible = 2067 && FilterBarVisibleEnum.exFilterBarCompact Or FilterBarVisibleEnum.exFilterBarSingleLine Or FilterBarVisibleEnum.exFilterBarVisible Or FilterBarVisibleEnum.exFilterBarPromptVisible
	with .Columns.Item(0)
		.FilterType = 240
		.Filter = "Item A|Item B"
	endwith
	.ApplyFilter
	.EndUpdate
endwith
|
|
983
|
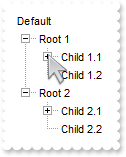
How can I prevent expanding/collapsing the child items
*** BeforeExpandItem event - Fired before an item is about to be expanded (collapsed). ***
LPARAMETERS Item, Cancel
	with thisform.Gantt1
		Cancel = thisform.Gantt1.Items.ItemParent(Item)
	endwith

with thisform.Gantt1
	.BeginUpdate
	.SingleSel = .F.
	.Columns.Add("Default")
	.LinesAtRoot = -1
	with .Items
		h = .AddItem("Root 1")
		.InsertItem(.InsertItem(h,Null,"Child 1.1"),Null,"Child")
		.InsertItem(h,Null,"Child 1.2")
		.DefaultItem = h
		.ExpandItem(0) = .T.
		h = .AddItem("Root 2")
		.InsertItem(.InsertItem(h,Null,"Child 2.1"),Null,"Child")
		.InsertItem(h,Null,"Child 2.2")
		.DefaultItem = h
		.ExpandItem(0) = .T.
	endwith
	.EndUpdate
endwith
|
|
982
|
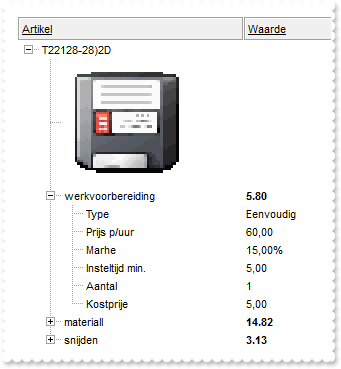
How can I display an item of picture type
with thisform.Gantt1
	.BeginUpdate
	.LinesAtRoot = -1
	.ScrollBySingleLine = .F.
	.HeaderAppearance = 4
	.HeaderHeight = 24
	.Columns.Add("Artikel").HTMLCaption = "<u>Artikel"
	.Columns.Add("Waarde").HTMLCaption = "<u>Waarde"
	.Object.HTMLPicture("T22128") = "c:\exontrol\images\zipdisk.gif"
	with .Items
		h = .AddItem("T22128-28)2D")
		h1 = .InsertItem(h,Null,"<img>T22128:128</img>")
		.DefaultItem = h1
		.CellCaptionFormat(0,0) = 1
		.DefaultItem = h1
		.ItemHeight(0) = 128
		h1 = .InsertItem(h,Null,"werkvoorbereiding")
		.DefaultItem = h1
		.CellCaption(0,1) = "5.80"
		.DefaultItem = h1
		.CellBold(0,1) = .T.
		.DefaultItem = .InsertItem(h1,Null,"Type")
		.CellCaption(0,1) = "Eenvoudig"
		.DefaultItem = .InsertItem(h1,Null,"Prijs p/uur")
		.CellCaption(0,1) = "60,00"
		.DefaultItem = .InsertItem(h1,Null,"Marhe")
		.CellCaption(0,1) = "15,00%"
		.DefaultItem = .InsertItem(h1,Null,"Insteltijd min.")
		.CellCaption(0,1) = "5,00"
		.DefaultItem = .InsertItem(h1,Null,"Aantal")
		.CellCaption(0,1) = 1
		.DefaultItem = .InsertItem(h1,Null,"Kostprije")
		.CellCaption(0,1) = "5,00"
		.DefaultItem = h1
		.ExpandItem(0) = .T.
		h1 = .InsertItem(h,Null,"materiall")
		.DefaultItem = h1
		.CellCaption(0,1) = "14.82"
		.DefaultItem = h1
		.CellBold(0,1) = .T.
		.DefaultItem = h1
		.ItemHasChildren(0) = .T.
		h1 = .InsertItem(h,Null,"snijden")
		.DefaultItem = h1
		.CellCaption(0,1) = "3.13"
		.DefaultItem = h1
		.CellBold(0,1) = .T.
		.DefaultItem = h1
		.ItemHasChildren(0) = .T.
		.DefaultItem = h
		.ExpandItem(0) = .T.
	endwith
	.EndUpdate
endwith
|
|
981
|
Dark mode
with thisform.Gantt1
	.BeginUpdate
	back = 65536
	fore = 16777215
	var_s = "gBFLBCJwBAEHhEJAAEhABXUIQAAYAQGKIcBiAKBQAGYBIJDEMgzDDAUBjKKocQTC4AIQjCK4JDKHYJRpHEZyCA8EhqGASRAFUQBYiWE4oSpLABQaK0ZwIGyRIrkGQgQg"
	var_s = var_s + "mPYDSDNU4zVIEEglBI0TDNczhNDENgtGYaJqHIYpZBcM40TKkEZoSIITZcRrOEBiRL1S0RBhGcRUHZlWzdN64LhuK47UrWdD/XhdVzXRbjfz1Oq+bxve48Br7A5yYThd"
	var_s = var_s + "r4LhOFQ3RjIL4xbIcUwGe6VZhjOLZXjmO49T69HTtOCYBEBA"
	.VisualAppearance.Add(1,var_s)
	var_s1 = "gBFLBCJwBAEHhEJAAEhABPMIQAAYAQGKIcBiAKBQAGaAoDDcMgwQwAAxjIKUEwsACEIrjKCYVgOHYYQjGMZwHCMIhiGwcAChEZYHgkMYmDAMUhSE78axHG6PY7kKZ4bi"
	var_s1 = var_s1 + "aKIqQLLEhSfJ0YyBECBZpfebIbjmIZMSLEIxDKItJSpCIaRgqWS6ahGO4JUbUFLQHT9IR4daIYRgEEBA"
	.VisualAppearance.Add(2,var_s1)
	var_s2 = "gBFLBCJwBAEHhEJAAEhABUUIQAAYAQGKIcBiAKBQAGaAoDDcMgwQwAAxjIKUEwsACEIrjKCYVgOHYYQjGMZwGAsEwjAoYAChEaILgkMw2DBIQwgJIMEr/G6RZxjeL5Cj"
	var_s2 = var_s2 + "mG4nDhKMpybAcXxjBIYZJgOQpXb+PobTrNNLzfRFAxVAaWJikcZ4HpIAJNVLFdQ0XYMNSBISsBqrKiKcpeIIDWBZMbRZT1ZABCIZBpEW6LahENQwXrCN74DYkNTdKaxb"
	var_s2 = var_s2 + "buaaXLhGCYBgIA=="
	.VisualAppearance.Add(3,var_s2)
	.HeaderAppearance = 5
	.BackColor = back
	.BackColorHeader = back
	.BackColorLevelHeader = back
	.BackColorSortBar = back
	.BackColorSortBarCaption = back
	.FilterBarBackColor = back
	.FilterBarForeColor = fore
	.ForeColor = fore
	.ForeColorHeader = fore
	.ForeColorSortBar = fore
	.SelBackColor = fore
	.SelForeColor = back
	.Object.Background(0) = 0x1000000
	.Object.Background(32) = -1
	.Object.Background(64) = 0x3000000
	.Object.Background(65) = back
	.Object.Background(66) = fore
	.Object.Background(20) = fore
	.Object.Background(21) = back
	.Object.Background(26) = back
	.Object.Background(27) = fore
	.Object.Background(28) = back
	.Object.Background(186) = fore
	.Object.Description(25) = "<bgcolor 0><fgcolor ffffff> Exclude </fgcolor></bgcolor>"
	with .Chart
		.BackColor = back
		.BackColorLevelHeader = back
		.ForeColor = fore
		.ForeColorLevelHeader = fore
	endwith
	.EndUpdate
endwith
|
|
980
|
How can I specify the cell's outline, border or lines around, when the cell gets selected

with thisform.Gantt1
	.BeginUpdate
	.AttachTemplate("handle AddColumn(Column){Column{Def(48)=4;Def(49)=4;}}")
	with .VisualAppearance
		var_s = "gBFLBCJwBAEHhEJAAEhABPEGACAADACAxRDgMQBQKAAzQFAYbBuGCGAAGIYBTgmFgAQhFcZQSpEEg7BKMYwjOJgFgmEQxDANIBQSKoaQiGQYYLhEZAEiONoaDJCM4wHI"
		var_s = var_s + "MQxHCKTZRkGcfaRCGSfIzpGKpVgOTYiTbPcIyQKtBxDIydJTmeQQQhsFIJU7SdVUPDUJZlWbLAwWTAYazXCKRZBpeJqdo6Y5RUDKUqSdLUYyvEq7ZqnOIpw5vICpaCqO"
		var_s = var_s + "p6HqKFpiXSAFL1fLmAwvPKrJjoeqpWpyCaRZQAGg4dbEdTNNCIbatQANKrCSpgZ7sMB6Di2L4TPS2awoWgRYyTFZMbBAeQ7LC1c45Fqrd4zS4dSxKCahcLxFiaNpYZYn"
		var_s = var_s + "jUap1jGPJlkuAgAkidB3nceZsCQEQJCgGhMGcQ4pkiSxEAAOYpiQIhvkYNA2gSCg5n+LIoGILowFyXQoAYAoAmASAWAaAZgggJgKF2T54DYDoDmECBGBKBJgGgTgWgWY"
		var_s = var_s + "RoFYGIGmGOBqByB5hCgegggiYJYgoJIICIaIeByChixULILGGGAWDCCgjCiTgrg0YxojoC4OmOSJ2D6D5kAgJLFgABAEICA="
		.Add(1,var_s)
		.Add(2,"CP:1 -4 0 0 0")
	endwith
	.SelBackColor = 0x2000000
	.SelForeColor = RGB(0,0,1)
	.FullRowSelect = 0
	.ShowFocusRect = .F.
	.DefaultItemHeight = 24
	.HeaderHeight = 24
	.DrawGridLines = 2
	.Columns.Add("C1")
	.Columns.Add("C2")
	with .Items
		.DefaultItem = .AddItem("Cell 1")
		.CellCaption(0,1) = "Cell 2"
		.DefaultItem = .AddItem("Cell 3")
		.CellCaption(0,1) = "Cell 4"
	endwith
	.Items.SelectPos = 1
	.SelectColumnIndex = 1
	.EndUpdate
endwith
|
|
979
|
How can I specify the cell's outline, border or lines around, when the item gets selected
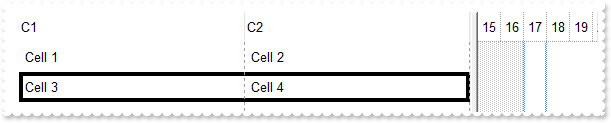
with thisform.Gantt1
	.BeginUpdate
	.AttachTemplate("handle AddColumn(Column){Column{Def(48)=4;Def(49)=4;}}")
	var_s = "gBFLBCJwBAEHhEJAAEhABPEGACAADACAxRDgMQBQKAAzQFAYbBuGCGAAGIYBTgmFgAQhFcZQSpEEg7BKMYwjOJgFgmEQxDANIBQSKoaQiGQYYLhEZAEiONoaDJCM4wHI"
	var_s = var_s + "MQxHCKTZRkGcfaRCGSfIzpGKpVgOTYiTbPcIyQKtBxDIydJTmeQQQhsFIJU7SdVUPDUJZlWbLAwWTAYazXCKRZBpeJqdo6Y5RUDKUqSdLUYyvEq7ZqnOIpw5vICpaCqO"
	var_s = var_s + "p6HqKFpiXSAFL1fLmAwvPKrJjoeqpWpyCaRZQAGg4dbEdTNNCIbatQANKrCSpgZ7sMB6Di2L4TPS2awoWgRYyTFZMbBAeQ7LC1c45Fqrd4zS4dSxKCahcLxFiaNpYZYn"
	var_s = var_s + "jUap1jGPJlkuAgAkidB3nceZsCQEQJCgGhMGcQ4pkiSxEAAOYpiQIhvkYNA2gSCg5n+LIoGILowFyXQoAYAoAmASAWAaAZgggJgKF2T54DYDoDmECBGBKBJgGgTgWgWY"
	var_s = var_s + "RoFYGIGmGOBqByB5hCgegggiYJYgoJIICIaIeByChixULILGGGAWDCCgjCiTgrg0YxojoC4OmOSJ2D6D5kAgJLFgABAEICA="
	.VisualAppearance.Add(1,var_s)
	.SelBackColor = 0x1000000
	.SelForeColor = RGB(0,0,1)
	.ShowFocusRect = .F.
	.DefaultItemHeight = 24
	.HeaderHeight = 24
	.DrawGridLines = 2
	.Columns.Add("C1")
	.Columns.Add("C2")
	with .Items
		.DefaultItem = .AddItem("Cell 1")
		.CellCaption(0,1) = "Cell 2"
		.DefaultItem = .AddItem("Cell 3")
		.CellCaption(0,1) = "Cell 4"
		.SelectPos = 1
	endwith
	.EndUpdate
endwith
|
|
978
|
How can I specify the cell's outline, border or lines around
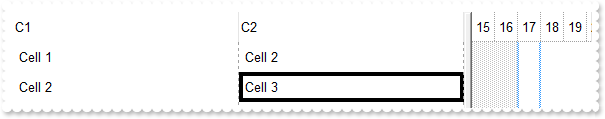
with thisform.Gantt1
	.BeginUpdate
	.AttachTemplate("handle AddColumn(Column){Column{Def(48)=4;Def(49)=4;}}")
	var_s = "gBFLBCJwBAEHhEJAAEhABPEGACAADACAxRDgMQBQKAAzQFAYbBuGCGAAGIYBTgmFgAQhFcZQSpEEg7BKMYwjOJgFgmEQxDANIBQSKoaQiGQYYLhEZAEiONoaDJCM4wHI"
	var_s = var_s + "MQxHCKTZRkGcfaRCGSfIzpGKpVgOTYiTbPcIyQKtBxDIydJTmeQQQhsFIJU7SdVUPDUJZlWbLAwWTAYazXCKRZBpeJqdo6Y5RUDKUqSdLUYyvEq7ZqnOIpw5vICpaCqO"
	var_s = var_s + "p6HqKFpiXSAFL1fLmAwvPKrJjoeqpWpyCaRZQAGg4dbEdTNNCIbatQANKrCSpgZ7sMB6Di2L4TPS2awoWgRYyTFZMbBAeQ7LC1c45Fqrd4zS4dSxKCahcLxFiaNpYZYn"
	var_s = var_s + "jUap1jGPJlkuAgAkidB3nceZsCQEQJCgGhMGcQ4pkiSxEAAOYpiQIhvkYNA2gSCg5n+LIoGILowFyXQoAYAoAmASAWAaAZgggJgKF2T54DYDoDmECBGBKBJgGgTgWgWY"
	var_s = var_s + "RoFYGIGmGOBqByB5hCgegggiYJYgoJIICIaIeByChixULILGGGAWDCCgjCiTgrg0YxojoC4OmOSJ2D6D5kAgJLFgABAEICA="
	.VisualAppearance.Add(1,var_s)
	.SelBackMode = 1
	.ShowFocusRect = .F.
	.DefaultItemHeight = 24
	.HeaderHeight = 24
	.DrawGridLines = 2
	.Columns.Add("C1")
	.Columns.Add("C2")
	with .Items
		.DefaultItem = .AddItem("Cell 1")
		.CellCaption(0,1) = "Cell 2"
		h = .AddItem("Cell 2")
		.DefaultItem = h
		.CellCaption(0,1) = "Cell 3"
		.DefaultItem = h
		.CellBackColor(0,1) = 0x1000000
	endwith
	.EndUpdate
endwith
|
|
977
|
Is it possible to highligth the match while a filter is applied
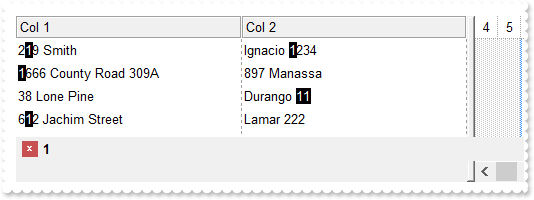
*** AddColumn event - Fired after a new column has been added. ***
LPARAMETERS Column
	*** Column.Def(17) = 1

*** FilterChange event - Occurs when the filter was changed. ***
LPARAMETERS nop
	with thisform.Gantt1
		format = .FormatABC("`value replace '` + value + `' with '<bgcolor 000000><fgcolor FFFFFF>` + value  + `</fgcolor></bgcolor>'`",.FilterBarPromptPattern)
		.Columns.Item(0).FormatColumn = format
		.Columns.Item(1).FormatColumn = format
	endwith

with thisform.Gantt1
	.BeginUpdate
	.DrawGridLines = 2
	.HeaderAppearance = 4
	.Columns.Add("Col 1")
	.Columns.Add("Col 2")
	with .Items
		.DefaultItem = .AddItem("219 Smith")
		.CellCaption(0,1) = "Ignacio 1234"
		.DefaultItem = .AddItem("1666 County Road 309A")
		.CellCaption(0,1) = "897 Manassa"
		.DefaultItem = .AddItem("38 Lone Pine")
		.CellCaption(0,1) = "Durango 11"
		.DefaultItem = .AddItem("612 Jachim Street")
		.CellCaption(0,1) = "Lamar 222"
	endwith
	.FilterBarPromptPattern = "1"
	.FilterBarPromptVisible = 2067 && FilterBarVisibleEnum.exFilterBarCompact Or FilterBarVisibleEnum.exFilterBarSingleLine Or FilterBarVisibleEnum.exFilterBarVisible Or FilterBarVisibleEnum.exFilterBarPromptVisible
	.FilterBarPromptType = 257 && FilterPromptEnum.exFilterPromptCaseSensitive Or FilterPromptEnum.exFilterPromptContainsAll
	.EndUpdate
endwith
|
|
976
|
Is it possible to highlight the column's header once a filter is applied (sample 2)
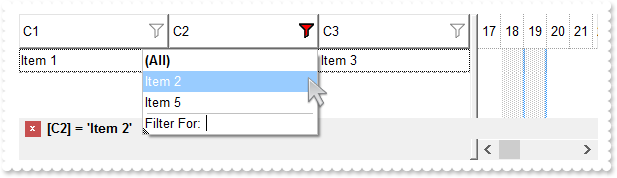
with thisform.Gantt1
	.BeginUpdate
	with .VisualAppearance
		var_s = "gBFLBCJwBAEHhEJAAEhABO8GACAADACAxRDgMQBQKAAzQFAYbBuGCGAAGIYBTgmFgAQhFcZQSKUOQTDKNYykCIRSDUJYkSZEIyjBI8ExXFqNACkGKwQgmNYDSBMcbwSA"
		var_s = var_s + "sXRYFocJ5gOT6AjKBA2UclEZpajiTY3ABUEgUS5oOBIACqariaQJAAiCRQGiYZyHKaRSwPBKFYDIIjbJheTIDChNVxUcDENQjJqLBIDRzbarye59YBfeBXdgmA4LQbDM"
		var_s = var_s + "RwNgMMQTDqKYbkOQZHbeGKAWTMEZzJj8cxTEqIaBhGTLfojSZMS7UGK1LLtMyHI6kP7sOiLfi2W4/W7XV72F79TzXIa2ZBuO57bhnAZ/VzGNj4PRNezfRqicjsGxcZwX"
		var_s = var_s + "g+TpQj0ew6gSOw7wSbozjsfYXi8PwMnSc52leHotl+MxjmoXh2nybxOH+SQtnYXx+D2P4vGMB56hQf5PCgBYeDwYBCEo1xggebgKH6IIDBYBgkiAQ5FgYPAhEIRgWGqD"
		var_s = var_s + "BoC4GoCiGCBYhGBQPAWdIQp0eIUiWCZigiJgqgqYpIioJQhmIMhBH0NxjEMag2g2Y4ImYOoOmOSJeDQNxXlOLR3ECUAQICA="
		.Add(1,var_s)
		var_s1 = "gBFLBCJwBAEHhEJAAEhABgsHQAAYAQGKIcBiAKBQAGaAoDDYNwwQwAAxDAKcEwsACEIrjKCRShyCYZRrGUgRCKQahLEiTIhGUYJHgmK4tRoAUgxWCEExrAaQJjjeCQFi"
		var_s1 = var_s1 + "6LAtDhPMByfQEZQIGyjkgjNLUcSbG4AKgkCiXfpUAJVP7FcgSABEEigNIxToOU4jFgeCYLQKQRK2RC9GQGFCbLhpYKIahGTYWVheN5XXblez9P7ABQwKCcAwXBp7YIKA"
		var_s1 = var_s1 + "T4XBIdYdQ7IL4xGA0AJPFoJC7mOQ5XiYAIBAZ/RL0LCcbxHHafVboQj6JouD5PUDVNY1XBdPynI6CbLhWy6Dq4UZzPwzeBifSHfDjRoJcCZe71KY3GwSEboNA6Kp+QBH"
		var_s1 = var_s1 + "AmZoZjSPYIEiF47lOLJVnuYofBwJJHmaQoYj0MIRHeM4/m6cJ8B+fpBHQJ5SGKPYYH8OYMk+P5Bn4fxaAYZAvEIX4RgUWBGgCCAmAqApgkgNgOgMEYlGASoEkQeBWBaB"
		var_s1 = var_s1 + "ZhggZgagaYRoEwShWA6NZZAMQBAICA=="
		.Add(2,var_s1)
	endwith
	.Object.Background(0) = 0x1000000
	.Object.Background(41) = 0x2000000
	.Object.Background(32) = -1
	.HeaderHeight = 28
	.BackColorHeader = RGB(255,255,255)
	.DrawGridLines = -2
	.HeaderVisible = 1
	with .Columns
		.Add("C1").DisplayFilterButton = .T.
		with .Add("C2")
			.DisplayFilterButton = .T.
			.Filter = "Item 2"
			.FilterType = 240
		endwith
		.Add("C3").DisplayFilterButton = .T.
	endwith
	with .Items
		h = .AddItem("Item 1")
		.DefaultItem = h
		.CellCaption(0,1) = "Item 2"
		.DefaultItem = h
		.CellCaption(0,2) = "Item 3"
		h = .AddItem("Item 4")
		.DefaultItem = h
		.CellCaption(0,1) = "Item 5"
		.DefaultItem = h
		.CellCaption(0,2) = "Item 6"
	endwith
	.ApplyFilter
	.EndUpdate
endwith
|
|
975
|
How can I make the expand/collapse glyphs DPI aware
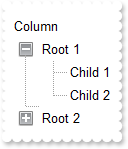
with thisform.Gantt1
	size = 2
	.BeginUpdate
	with .VisualAppearance
		var_s = "gBFLBCJwBAEHhEJAAEhEGAUHQAAYAQGKIcBiAKBQAGaAoDDYOA4QwAAxDAKcEwsACEIrjKCRShyCYZRhGcTSBCIZBqEqSZLiEZRQiiCYsS5GQBRfIUEghGyNZjgNzQcC"
		var_s = var_s + "QAI8T5IUgARBJIDSMY6DpOIxYHgmC4DEITNLxOK0EhRHCBZrgOCAYhqEY1Ro+dhPFYjVTMdK0LRtKy7Mq2aJmOpZDxWE7dZKpO5fbxXS67cr2fp/YBed4rfa7KTlOBKc"
		var_s = var_s + "RQRBEFQPDqPZBkORZHh2FoLRJKbgtHJmHYNQWhVyYBbNCyTI6lahpeuHBx1QaWWxjbCMEr6bpoWLbFi3Ha1UzrPa8b5vSw7Gr+HzYQTHGPXGqaYJdZrnea6B7+U5XUJr"
		var_s = var_s + "nSOZciYHwhAeR5HDK+JVGqKRRmScx5HyfRei+H5bmmcp4Fi8o/CGGJKGQKZUGoFQigUPIiCeSZXnyHB6l0SAJn8JxfkIeZ5CgXxjCCAhyB8QgIlAM4MlKAIcCaIBIGYG"
		var_s = var_s + "oGGEYhqBMMxgnICgRDUDQjESGwmAkWBuCqBoiHIVgkDQYgYESWg2E0YhohcJQigITg3CQSRyEyEYGGOWJwhQJD4FiFIMk0aJFGsIBkkOBJeDc+AchYJwJgIWhSgYZQpF"
		var_s = var_s + "IVoVGOGQ4l2EwIBWMhgDmDhThCEwkAiaJchKDhjhgZhsCUY4iFCEoZkiaYQmSGAWhWQhgDuDpTjCDQiEgchAg0IpJBoDoFiEKBqCaCAimgIguH8IZnkPUhcBcJg+hGJZ"
		var_s = var_s + "nloYJsiaKZKGa24YnWSR0CkKhCA2CxlCqColhAYpqEKER0DqVZ0A0ASAgA=="
		.Add(3,var_s)
		var_s1 = "gBFLBCJwBAEHhEJAAEhABAQCg6AADACAxRDgMQBQKAAzQFAYbBwHCGAAGIYBTgmFgAQhFcZQSKUOQTDKNYykCIRSDUJYkSZEIyjBI8ExXFqNACjeQYJBCNYbTJAbqhYI"
		var_s1 = var_s1 + "gAR3HqQZABCCSQKkYx0HScRiwPBMFwGIQmaaicZoJCiN4DTZAcIBRDUIxpDR9bBeKw3KqVaZnWhaNpWXZlTzKdSxXisF67RZSdi/XgvF5XXblez9P69LwXe5mUrGbyVY"
		var_s1 = var_s1 + "ghCCIKgeG4dR7IMhyLDcKQXCCVW7aGSsOwbAqAXpdGAXTQdDyLJKnaZqOi6BjjA4rNbHGIYJb1XTRMa1LJuG5LJrOeZ3Xre4BLfh1VoFRpjWIYNY1QS7TLOczzfRdDxT"
		var_s1 = var_s1 + "iGVpkjCeJoD4Ng1hSRxiisVRKg8D4PkWZJznmPQ+F8Xx5guWpjHGWYMiYQodEaIRSCgU5KCSeh3naHB/iAAh9n8fwfgIeZ1CgXwjCCAhxl8AgIlAM4MlKAIcCaD54FYF"
		var_s1 = var_s1 + "oFmGCBmBaBIJigPJNgKSAoDSVC+BIbIYCUYYoiYKoJgkWIMlGCAglMaJZDWCYiFyFIJkkOJYhEJc7G4PYPCOaJshQJBjgiVIUgyDRokEaggGSQ4El4N1CBiFgnAmAhaF"
		var_s1 = var_s1 + "KFZlFkShUhWJRYmITg3GSQgFGuGBOGOFJkCSSQCDoNgkiOCY0hUJJmmmQhvhqZtYmUOQmBWIRvhgTpjjSbAjEiEgchBZgyEaBIhigWgegqIhIjoDILiACB5nTL5WnWRY"
		var_s1 = var_s1 + "OiSKYJnqGQ7CmOh2hqJ5OkYORxFyShKhSAxihkOomioY5YiqFIkFyTo1HkAxAEAgIA=="
		.Add(4,var_s1)
		.Add(1,thisform.Gantt1.FormatABC("`CP:3 -` + int(value*dpi) + ` -` + int(value*dpi) + ` ` +  int(value*dpi) + ` ` + int(value*dpi)",size))
		.Add(2,thisform.Gantt1.FormatABC("`CP:4 -` + int(value*dpi) + ` -` + int(value*dpi) + ` ` +  int(value*dpi) + ` ` + int(value*dpi)",size))
	endwith
	.LinesAtRoot = 1
	.HasButtons = 4
	.Object.HasButtonsCustom(0) = 16777216
	.Object.HasButtonsCustom(1) = 33554432
	.Columns.Add("Column")
	with .Items
		h = .AddItem("Root 1")
		.InsertItem(h,Null,"Child 1")
		.InsertItem(h,Null,"Child 2")
		.DefaultItem = h
		.ExpandItem(0) = .T.
		h = .AddItem("Root 2")
		.InsertItem(h,Null,"Child")
	endwith
	.EndUpdate
endwith
|
|
974
|
Is it possible to highlight the column's header once a filter is applied (sample 1)
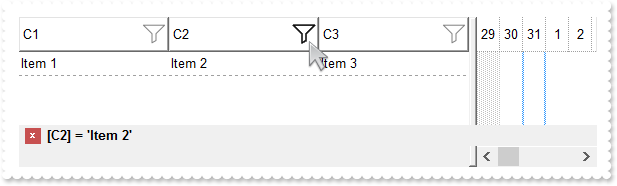
with thisform.Gantt1
	.BeginUpdate
	with .VisualAppearance
		var_s = "gBFLBCJwBAEHhEJAAEhABX8GACAADACAxSDEMQBQKAAzQFAYbhgHCGAAGQaBUgmFgAQhFcZQSKUOQTDKNYykCIRSDUJYkSZEIyjBI8ExXFqNACkGKwYgmNYiTLAcgANJ"
		var_s = var_s + "0WBaGIZJ4gOT5fDKMoEDRRYADFCscwxJybQAqGQKKb+VgAVY/cTyBIAEQSKA0TDOQ5TSKWB4JPZQRBEbZMNBtBIUJquKaqShdQJCU5FdY3Xblez9P7AMBwLFEC4NQ8YN"
		var_s = var_s + "YuPhjR4dRTIMhvVAsUArFh8Zg9GZZFjmDIDT4ydBLTQwcyVIKnP5qOa6XbmPoCQDYKxZHYxPzVDa3axuL76dqCAT7XrXNy1TbNRrzQKfcJqfCbdw2YaDZLOOT3fjuI4h"
		var_s = var_s + "hKaRzFAHJ+jYQ4xHuY4gHuGIXGeExqC8Tp6C+PoEm+G5ImycRgh0XwvDGa5rgOeoejyXwnFeQp2mkf5ClgBB9gCWIYAwfYAEKV58mkdwOggNArgOXY2EWLoDkKOA0mgb"
		var_s = var_s + "hOGgZApgaSBIHWSYHSmbApgYThmESZYJkIeIkgeCpfliLIHgpMIcmUYYYmODAlg2SI4mWfRfGOEguDcCRjFYAJihCQhJBSDoRmONgKEcI4kFCEJhhOVYTmYnAlEAQhWB"
		var_s = var_s + "MJYJGYWoWmWSR2F6F5lnkWAQhUAgpEieRWEuSYkjWGpmkmNhuhuZwJkYcocmaaYkjyEhngnUA6lEFAlAEgI="
		.Add(2,var_s)
		.Add(1,"CP:2 -8 -4 2 4")
	endwith
	.Object.Background(0) = 0x1fefefe
	.Object.Background(41) = 0x1010101
	.Object.Background(32) = -1
	.HeaderHeight = 28
	.BackColorHeader = RGB(255,255,255)
	.DrawGridLines = -2
	.HeaderVisible = 1
	with .Columns
		.Add("C1").DisplayFilterButton = .T.
		with .Add("C2")
			.DisplayFilterButton = .T.
			.Filter = "Item 2"
			.FilterType = 240
		endwith
		.Add("C3").DisplayFilterButton = .T.
	endwith
	with .Items
		h = .AddItem("Item 1")
		.DefaultItem = h
		.CellCaption(0,1) = "Item 2"
		.DefaultItem = h
		.CellCaption(0,2) = "Item 3"
		h = .AddItem("Item 4")
		.DefaultItem = h
		.CellCaption(0,1) = "Item 5"
		.DefaultItem = h
		.CellCaption(0,2) = "Item 6"
	endwith
	.ApplyFilter
	.EndUpdate
endwith
|
|
973
|
Is it possible to show the filterbar on top of the rows
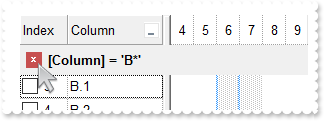
with thisform.Gantt1
	.BeginUpdate
	.FilterBarPromptVisible = 8192
	.HeaderHeight = 24
	.FilterBarHeight = .HeaderHeight
	.HeaderAppearance = 1
	.DrawGridLines = -1
	.GridLineStyle = 512
	with .Columns.Add("Column")
		.DisplayFilterButton = .T.
		.FilterType = 3
		.Filter = "B*"
	endwith
	with .Columns.Add("Index")
		.FormatColumn = "1 index ``"
		.Position = 0
		.Width = 48
		.AllowSizing = .F.
		.SortType = 1
		.Def(0) = .T.
	endwith
	with .Items
		.AddItem("A.1")
		.AddItem("A.2")
		.AddItem("B.1")
		.AddItem("B.2")
		.AddItem("B.3")
		.AddItem("C")
	endwith
	.ApplyFilter
	.EndUpdate
endwith
|
|
972
|
Is there anyway to stop the header changing colour when the mouse hovers/moves across the column header (non-clickable)
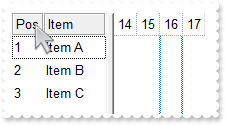
with thisform.Gantt1
	.BeginUpdate
	.HeaderAppearance = 4
	with .Columns
		.Add("Item")
		with .Add("Pos")
			.Position = 0
			.Width = 32
			.AllowSizing = .F.
			.FormatColumn = "1 index ``"
			.AllowSort = .F.
			.AllowDragging = .F.
		endwith
	endwith
	with .Items
		.AddItem("Item A")
		.AddItem("Item B")
		.AddItem("Item C")
	endwith
	.EndUpdate
endwith
|
|
971
|
Is there anyway to stop the header changing colour when the mouse hovers/moves across the column header
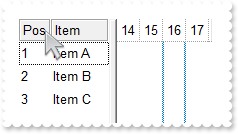
with thisform.Gantt1
	.BeginUpdate
	.HeaderAppearance = 4
	.Object.Background(32) = -1
	with .Columns
		.Add("Item")
		with .Add("Pos")
			.Position = 0
			.Width = 32
			.AllowSizing = .F.
			.FormatColumn = "1 index ``"
			.AllowSort = .F.
			.AllowDragging = .F.
		endwith
	endwith
	with .Items
		.AddItem("Item A")
		.AddItem("Item B")
		.AddItem("Item C")
	endwith
	.EndUpdate
endwith
|
|
970
|
I would like to display a solid line between "root" items, and dotted lines (default) between child items. How can I do that
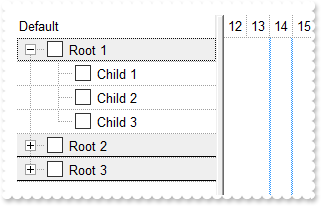
with thisform.Gantt1
	.BeginUpdate
	.LinesAtRoot = -1
	.DrawGridLines = 1
	.GridLineStyle = 512
	var_s = "gBFLBCJwBAEHhEJAAEhABMsIQAAYAQGKIcBiAKBQAGaAoDgYN4MAANAwjJBMKgBBCLIxhEYobgmGIXRpFMbxAKQahLEiTIgGUYJHgmK4tQLHb7zGAABRDDSOIDnGQJXh"
	var_s = var_s + "aI4JQSMMQDGLAZxVFiPRhAWLpBh+PQATrOdLUfSjVwhBKAQEBA=="
	.VisualAppearance.Add(1,var_s)
	with .Columns.Add("Default")
		.Def(0) = .T.
		.PartialCheck = .T.
	endwith
	with .Columns.Add("Position")
		.FormatColumn = "((1 rindex ``) contains `.`) = 0"
		.Visible = .F.
	endwith
	with .ConditionalFormats.Add("%C1")
		.BackColor = 0x1e0e0e0
	endwith
	with .Items
		h = .AddItem("Root 1")
		.InsertItem(h,Null,"Child 1")
		.InsertItem(h,Null,"Child 2")
		.InsertItem(h,Null,"Child 3")
		.DefaultItem = h
		.ExpandItem(0) = .T.
		h = .AddItem("Root 2")
		.InsertItem(h,Null,"Child 1")
		.InsertItem(h,Null,"Child 2")
		h = .AddItem("Root 3")
		.InsertItem(h,Null,"Child 1")
		.InsertItem(h,Null,"Child 2")
	endwith
	.EndUpdate
endwith
|
|
969
|
I can not center or align the cell's caption and icon, when it displays the hierarchy
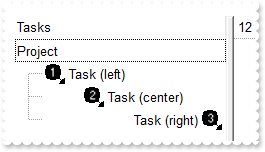
with thisform.Gantt1
	.BeginUpdate
	var_s = "gBJJgBAIDAAGAAEAAQhYAf8Pf4hh0QihCJo2AEZjQAjEZFEaIEaEEaAIAkcbk0olUrlktl0vmExmUzmk1m03nE5nU7nk9n0/oFBoVDolFo1HpFJpVLplNp1PqFRqVTql"
	var_s = var_s + "Vq1XrFZrVbrldr1fsFhsVjslls1ntFptVrtltt1vuFxuVzul1u13vF5vV7vl9v1/wGBwWDwmFw2HxGJxWLxmNx0xiFdyOTh8Tf9ZymXx+QytcyNgz8r0OblWjyWds+m0"
	var_s = var_s + "ka1Vf1ta1+r1mos2xrG2xeZ0+a0W0qOx3GO4NV3WeyvD2XJ5XL5nN51aiw+lfSj0gkUkAEllHanHI5j/cHg8EZf7w8vl8j4f/qfEZeB09/vjLAB30+kZQAP/P5/H6/yN"
	var_s = var_s + "AOAEAwCjMBwFAEDwJBMDwLBYAP2/8Hv8/gAGAD8LQs9w/nhDY/oygIA="
	.Images(var_s)
	with .Columns.Add("Tasks")
		.Def(17) = 1
	endwith
	.HeaderVisible = 1
	with .Items
		h = .AddItem("Project")
		hChild = .InsertItem(h,Null,"<img>1</img> Task (left)")
		hChild = .InsertItem(h,Null,"<c><img>2</img> Task (center)")
		hChild = .InsertItem(h,Null,"<r>Task (right) <img>3</img>")
		.DefaultItem = h
		.ExpandItem(0) = .T.
	endwith
	.EndUpdate
endwith
|
|
968
|
How do I set an extra data for each item
*** MouseMove event - Occurs when the user moves the mouse. ***
LPARAMETERS Button, Shift, X, Y
	with thisform.Gantt1
		i = .ItemFromPoint(-1,-1,c,hit)
		DEBUGOUT( i )
		DEBUGOUT( .Items.ItemData(i) )
	endwith

with thisform.Gantt1
	.BeginUpdate
	.ColumnAutoResize = .T.
	.Columns.Add("Default")
	with .Items
		.DefaultItem = .AddItem("method 1")
		.ItemData(0) = "your extra data of method 1"
		.InsertItem(0,"your extra data of method 2","method 2")
	endwith
	with .Items
		.DefaultItem = .AddItem("method 3")
		.ItemData(0) = "your extra data of method 3"
	endwith
	.EndUpdate
endwith
|
|
967
|
I do not like to specify the item padding for every column I add. The question is how can I do it automatically
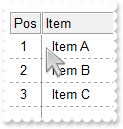
with thisform.Gantt1
	.BeginUpdate
	.AttachTemplate("handle AddColumn(Column){Column{Def(48)=8;Def(49)=8;AllowDragging=False;AllowSizing = True}}")
	.HeaderAppearance = 4
	.DrawGridLines = -1
	.GridLineStyle = 32
	with .Columns
		.Add("Item")
		with .Add("Pos")
			.Position = 0
			.Width = 32
			.AllowSizing = .F.
			.FormatColumn = "1 index ``"
		endwith
	endwith
	with .Items
		.AddItem("Item A")
		.AddItem("Item B")
		.AddItem("Item C")
	endwith
	.EndUpdate
endwith
|
|
966
|
Can I sort the column by check-state
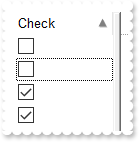
with thisform.Gantt1
	.BeginUpdate
	with .Columns.Add("Check")
		.Def(0) = .T.
		.SortType = 32
	endwith
	with .Items
		.AddItem()
		.DefaultItem = .AddItem()
		.CellState(0,0) = 1
		.DefaultItem = .AddItem()
		.CellState(0,0) = 1
		.AddItem()
	endwith
	.Columns.Item(0).SortOrder = 1
	.EndUpdate
endwith
|
|
965
|
Can I sort the column by image
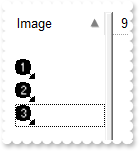
with thisform.Gantt1
	.BeginUpdate
	var_s = "gBJJgBAIDAAGAAEAAQhYAf8Pf4hh0QihCJo2AEZjQAjEZFEaIEaEEaAIAkcbk0olUrlktl0vmExmUzmk1m03nE5nU7nk9n0/oFBoVDolFo1HpFJpVLplNp1PqFRqVTql"
	var_s = var_s + "Vq1XrFZrVbrldr1fsFhsVjslls1ntFptVrtltt1vuFxuVzul1u13vF5vV7vl9v1/wGBwWDwmFw2HxGJxWLxmNx0xiFdyOTh8Tf9ZymXx+QytcyNgz8r0OblWjyWds+m0"
	var_s = var_s + "ka1Vf1ta1+r1mos2xrG2xeZ0+a0W0qOx3GO4NV3WeyvD2XJ5XL5nN51aiw+lfSj0gkUkAEllHanHI5j/cHg8EZf7w8vl8j4f/qfEZeB09/vjLAB30+kZQAP/P5/H6/yN"
	var_s = var_s + "AOAEAwCjMBwFAEDwJBMDwLBYAP2/8Hv8/gAGAD8LQs9w/nhDY/oygIA="
	.Images(var_s)
	with .Columns.Add("Image")
		.SortType = 48
	endwith
	with .Items
		.DefaultItem = .AddItem()
		.CellImage(0,0) = 3
		.AddItem()
		.DefaultItem = .AddItem()
		.CellImage(0,0) = 1
		.DefaultItem = .AddItem()
		.CellImage(0,0) = 2
	endwith
	.Columns.Item(0).SortOrder = 1
	.EndUpdate
endwith
|
|
964
|
How can I display UNICODE characters
with thisform.Gantt1
	.BeginUpdate
	.Chart.PaneWidth(1) = 0
	with .Font
		.Name = "Arial Unicode"
		.Size = 22
	endwith
	.HeaderVisible = .F.
	.DefaultItemHeight = 48
	.Columns.Add("").Def(17) = 1
	with .Items
		.AddItem("Ӓӓ")
		.AddItem("ᦜᦝ;ᦞ")
		.AddItem("ɮɭ;ɯ")
		.AddItem("勳勴勵勶")
		.DefaultItem = .AddItem(thisform.Gantt1.Version)
		.FormatCell(0,0) = "(value lfind `UNICODE`) < 0 ? `<fgcolor=FF0000><b>!UNICODE!</b> version</fgcolor> required: ` + value : `` "
	endwith
	.EndUpdate
endwith
|
|
963
|
How do I display the position of the item with 0-padding
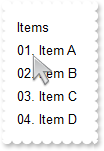
with thisform.Gantt1
	.BeginUpdate
	.Columns.Add("Items").FormatColumn = "((1 apos ``) lpad `00`) + `. `  + value"
	with .Items
		.AddItem("Item A")
		.AddItem("Item B")
		.AddItem("Item C")
		.AddItem("Item D")
	endwith
	.EndUpdate
endwith
|
|
962
|
Can't get the +/- to be displayed on a divider item. What else can I do
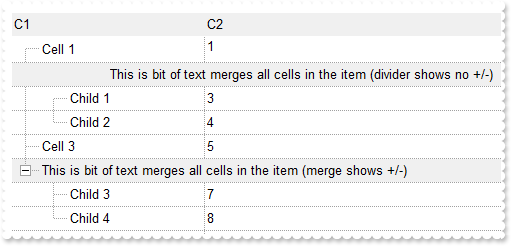
with thisform.Gantt1
	.BeginUpdate
	.LinesAtRoot = -1
	.DrawGridLines = -1
	.TreeColumnIndex = 0
	.MarkSearchColumn = .F.
	.FullRowSelect = 0
	.HeaderAppearance = -1 && 0xfffffff8 Or AppearanceEnum.Bump Or AppearanceEnum.Sunken
	.Chart.PaneWidth(1) = 0
	with .Columns
		.Add("C1").Width = 32
		.Add("C2").FormatColumn = "1 index ``"
	endwith
	with .Items
		h = .AddItem("Cell 1")
		.DefaultItem = h
		.CellSingleLine(0,1) = .F.
		h = .AddItem("This is bit of text merges all cells in the item (divider shows no +/-)")
		.DefaultItem = h
		.ItemDivider(0) = 0
		.DefaultItem = h
		.ItemBackColor(0) = RGB(240,240,240)
		.DefaultItem = h
		.ItemDividerLine(0) = 0
		.DefaultItem = h
		.CellHAlignment(0,0) = 1
		.InsertItem(h,Null,"Child 1")
		.InsertItem(h,Null,"Child 2")
		.DefaultItem = h
		.ExpandItem(0) = .T.
		h = .AddItem("Cell 3")
		h = .AddItem("This is bit of text merges all cells in the item (merge shows +/-)")
		.DefaultItem = h
		.ItemBackColor(0) = RGB(240,240,240)
		.DefaultItem = h
		.CellMerge(0,0) = 1
		.InsertItem(h,Null,"Child 3")
		.InsertItem(h,Null,"Child 4")
		.DefaultItem = h
		.ExpandItem(0) = .T.
	endwith
	.EndUpdate
endwith
|
|
961
|
ADODB Requery sample
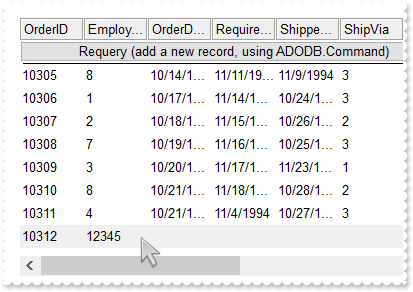
*** CellButtonClick event - Fired after the user clicks on the cell of button type.  ***
LPARAMETERS Item, ColIndex
	with thisform.Gantt1
		cmd = CreateObject("ADODB.Command")
		with cmd
			.ActiveConnection = thisform.Gantt1.DataSource.ActiveConnection
			.CommandText = "INSERT INTO Orders (EmployeeID) VALUES(12345)"
			.CommandType = 1
			.Execute()
		endwith
		.DataSource.Requery()
	endwith

with thisform.Gantt1
	.BeginUpdate
	.HeaderAppearance = 4
	.ColumnAutoResize = .F.
	rs = CreateObject("ADODB.Recordset")
	with rs
		.Open("Select * From Orders","Provider=Microsoft.ACE.OLEDB.12.0;Data Source=C:\Program Files\Exontrol\ExGantt\Sample\Access\sample.accdb",1,3)
	endwith
	.DataSource = rs
	.ConditionalFormats.Add("%1=12345").BackColor = RGB(240,240,240)
	with .Items
		.LockedItemCount(0) = 1
		h = .LockedItem(0,0)
		.DefaultItem = h
		.ItemDivider(0) = 0
		.DefaultItem = h
		.CellHasButton(0,0) = .T.
		.DefaultItem = h
		.CellCaption(0,0) = "Requery (add a new record, using ADODB.Command)"
		.DefaultItem = h
		.CellHAlignment(0,0) = 1
	endwith
	.EndUpdate
endwith
|
|
960
|
I am skinning the control's header-bar, but the background of the header-bar is shown on each item in the filter-bar drop down panel. What can I do
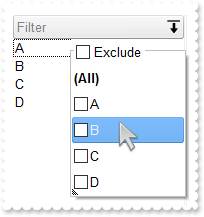
with thisform.Gantt1
	.BeginUpdate
	with .VisualAppearance
		var_s = "gBFLBCJwBAEHhEJAAEhABFgDg6AADACAxRDgMQBQKAAzQFAYcBqGqGAAGQZxYgmFgAQhFcZQSKUOQTDKMIziYBYfgkMIgSbJUgDGAkRRdDSOYDmGQYDiCIoRShOMIjHL"
		var_s = var_s + "UXxtDaIZwhEAoJb+RgAUY/cTzaAEUwHHiTKInaCQGhsCYJUJAdRURQ9EwvCIZBpEWwLChENQwWLCNj2TScBwjCyqbale45ViqdoDU8lORLUi+M4zSBPcZVTRtGShPDBK"
		var_s = var_s + "TjMKKYgkG4lVpRNa0PC1GTzQ6mazkKQLRADDIDVbAeL3LiMBy9LyLLItQALByua5mWhbcZyBCOPgBTrRb5zO58FjuTK7YLjMB7NrUNYtFaUMy2OpOCADIaecTNcaWLxP"
		var_s = var_s + "F2MY1HWYxVj2Jw3DuRJonKYBgggSRAlIYw6B0ThGFgPAkFUDAhBMfZRiGNAkFECZnm4YQdneJwqnsSQrGAAhWAIJBJBIQgFCQIBiEIAglgqYo0i4V4MEgRI9gSToYFSb"
		var_s = var_s + "4Fk6Y4+BmBZhFOJgTC8TBogQAArgqco4muCZOkOMJtgmYpIjYKg7GKE4uCUK4AAKKg2DwI4DiCZw5k6KJ2D6D4OHiag4DwIxiiQAArAqMosnEPBPAOIhOg+DozjIJ4PG"
		var_s = var_s + "SY4iEwPAkhKLhHUUSQsnKFCnkYU9MjORhcCsAAIACLQ8iaSJ6FKC5jJoaobA8KYoACCRKnmMJzhuDpZnSboMCKGJ4nMPIPDmYAACwKIDk6CoLCeU40m6I5oliMoKDyaI"
		var_s = var_s + "CokLIpgoThviOKJoGYf4KmUKhMjMLJLCAAojCyaYoiYGoGmqM46CkOwPEoKonAACxKlSdItmiWBeBeDgrioNo3D0KxSlAAAtgsUpYnUPRPEoco8hCa+T40SxbBRj5tEs"
		var_s = var_s + "HJ1i6JhbGYS4ug8awelQLZAAKZI5C4DxrhYQ9ehmUppWiA48nAPRuFKYpiAAC47laZQ9iuKZSgOPotkuFI7C6C4gACPJAm8eQOhOQZoikDp3kCS5AACPoEk8fBGnqQgp"
		var_s = var_s + "DOSppD2TxjlyPZD6CfwekQTx5lKP5ImseZTCAL5MAMAAAkoTADmMLpIjISp+HSS4PgyMAADBzAHDSIoPCOUpWjObIKE8NJOHKIwPEaTprBsHpdjWLB9AieQ+DQYwQAAM"
		var_s = var_s + "R1EOZxWi+bx7HcWQ8msfRYnnDhQACRwxgwc5rGaMZPE0ZxqjWNZtgyRwAAyTZEnuXJzEyAx2kQcxNkye5cEy3cYAcANrGAIH4OAhx3gNGGPAfgIR8jBA4McBMARViHH4"
		var_s = var_s + "HQOYmxuCpF2MsecEQVBvGQCcIQvA6i2CAAIARAQ="
		.Add(1,var_s)
		var_s1 = "gBFLBCJwBAEHhEJAAEhABZEGACAADACAxRDgMQBQKAAzQFAYcBqGqGAAGQZxYgmFgAQhFcZQSKUOQTDKMIziYBYJhEMwwDhEIwjHCEEhsGIbJAGQBJCjWGodQLOEgzNC"
		var_s1 = var_s1 + "0IxNFCQILhEZJADKII8TTOU5UPRESwTE4cKBmKhQCo2NpKR7VUTxCKQahLLivoCjBT8EzHMqtIzrCA6MpaP4pQjKcqwHJ8YyHEi0ZrjazKaj6T5AXDUcaWbbNVx3PK3a"
		var_s1 = var_s1 + "ioOpLZrqOZZYzYFoABTuJzPMSyIhxXD8cweaZvSpLExVYK9BY3PbKMgxC77QgTIpDaQMNS6PjtF43PAALLFUaNYzoOKzABMHATBIXAYJCwIIR5G7ID4BbQcCQAHL9DBa"
		var_s1 = var_s1 + "EEIAEEISgGhMGZQmocgymmIRQkIEQ2BcGgbEIRQci8XaMBqTRVgSAZHG+S5pnOep+D6f4vjec5zn0fpfmgBgAH6TRoBYBoAh+eAmAiAgPFgNArgOQpIESdoEmCOAOAqB"
		var_s1 = var_s1 + "YfFGAgaEaBgYHYFYFmIB5UiGCJUgKCgmgeYoHk4BgCmKRQiCwApgHgYgyH8B54lQU4NkMeJlBoDgjkiXBTg0R54iYIR+koeQVBoKpkgkChKhEJBkF4SFEjkDgJhFQoeE"
		var_s1 = var_s1 + "mDJlBeehUhWJQJGIXoICWOQ6FeFIlhkfhlDsSJpiQVoamaSY2G6G5nAmRhpCOH5pkwVYdmeCZmHqHpnkmdhzhmaAIFiax8AABAEICA=="
		.Add(2,var_s1)
	endwith
	.BackColorHeader = 0x1000000
	.ForeColorHeader = RGB(128,128,128)
	.Object.Background(0) = 0x2000000
	.Object.Background(26) = RGB(255,255,255)
	.Object.Background(27) = RGB(0,0,1)
	.Object.Background(20) = 0x1ff8000
	.Object.Background(21) = RGB(240,240,240)
	.Object.Background(32) = -1
	.HeaderHeight = 24
	.BackColorLevelHeader = .BackColor
	with .Columns.Add("Filter")
		.DisplayFilterButton = .T.
		.DisplayFilterPattern = .F.
		.FilterList = 9504 && FilterListEnum.exShowExclude Or FilterListEnum.exShowFocusItem Or FilterListEnum.exShowCheckBox Or FilterListEnum.exSortItemsAsc
		.Def(52) = 2
		.Def(53) = 2
	endwith
	with .Items
		.AddItem("A")
		.AddItem("B")
		.AddItem("C")
		.AddItem("D")
	endwith
	.EndUpdate
endwith
|
|
959
|
How do I use the ColumnsFloatBarVisible on exColumnsFloatBarVisibleIncludeCheckColumns
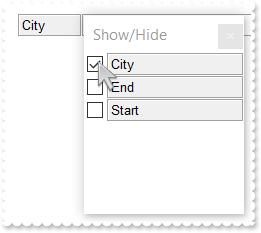
with thisform.Gantt1
	.BeginUpdate
	.ColumnAutoResize = .F.
	.HeaderAppearance = 4
	with .Columns
		.Add("City")
		.Add("Start").Visible = .F.
		.Add("End").Visible = .F.
	endwith
	.Object.Description(26) = "Show/Hide"
	.ColumnsFloatBarSortOrder = 1
	.ColumnsFloatBarVisible = 2
	.EndUpdate
endwith
|
|
958
|
How do I use the ColumnsFloatBarVisible on exColumnsFloatBarVisibleIncludeHiddenColumn
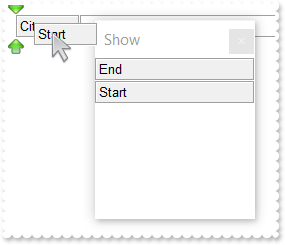
with thisform.Gantt1
	.BeginUpdate
	.ColumnAutoResize = .F.
	.HeaderAppearance = 4
	with .Columns
		.Add("City")
		.Add("Start").Visible = .F.
		.Add("End").Visible = .F.
	endwith
	.Object.Description(26) = "Show"
	.ColumnsFloatBarVisible = -1
	.ColumnsFloatBarSortOrder = 1
	.EndUpdate
endwith
|
|
957
|
Type of wraps the cell's caption support (Sample 2)
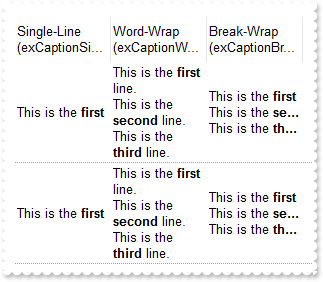
with thisform.Gantt1
	.BeginUpdate
	.HeaderSingleLine = .F.
	.HeaderHeight = 36
	.DrawGridLines = -2
	.ColumnAutoResize = .F.
	.ScrollBySingleLine = .T.
	with .Columns
		with .Add("Single-Line (exCaptionSingleLine)")
			.Width = 96
			.Def(17) = 1
			.Def(16) = -1
		endwith
		with .Add("Word-Wrap (exCaptionWordWrap)")
			.Width = 96
			.Def(17) = 1
			.Def(16) = 0
			.FormatColumn = "%0"
		endwith
		with .Add("Break-Wrap (exCaptionBreakWrap)")
			.Width = 96
			.Def(17) = 1
			.Def(16) = 1
			.FormatColumn = "%0"
		endwith
	endwith
	with .Items
		.AddItem("This is the <b>first</b> line.<br>This is the <b>second</b> line.<br>This is the <b>third</b> line.")
		.AddItem("This is the <b>first</b> line.\r\nThis is the <b>second</b> line.\r\nThis is the <b>third</b> line.")
	endwith
	.EndUpdate
endwith
|
|
956
|
Type of wraps the cell's caption support (Sample 1)
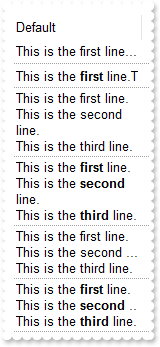
with thisform.Gantt1
	.BeginUpdate
	.HeaderSingleLine = .F.
	.HeaderHeight = 36
	.DrawGridLines = -2
	.ColumnAutoResize = .F.
	.ScrollBySingleLine = .T.
	.Columns.Add("Default").Width = 128
	with .Items
		h = .AddItem("This is the first line.\r\nThis is the second line.\r\nThis is the third line.")
		h = .AddItem("This is the <b>first</b> line.<br>This is the <b>second</b> line.<br>This is the <b>third</b> line.")
		.DefaultItem = h
		.CellCaptionFormat(0,0) = 1
		h = .AddItem("This is the first line.\r\nThis is the second line.\r\nThis is the third line.")
		.DefaultItem = h
		.CellSingleLine(0,0) = 0
		h = .AddItem("This is the <b>first</b> line.<br>This is the <b>second</b> line.<br>This is the <b>third</b> line.")
		.DefaultItem = h
		.CellCaptionFormat(0,0) = 1
		.DefaultItem = h
		.CellSingleLine(0,0) = 0
		h = .AddItem("This is the first line.\r\nThis is the second line.\r\nThis is the third line.")
		.DefaultItem = h
		.CellSingleLine(0,0) = 1
		h = .AddItem("This is the <b>first</b> line.<br>This is the <b>second</b> line.<br>This is the <b>third</b> line.")
		.DefaultItem = h
		.CellCaptionFormat(0,0) = 1
		.DefaultItem = h
		.CellSingleLine(0,0) = 1
	endwith
	.EndUpdate
endwith
|
|
955
|
Can I break the cell's caption using the line break <br> or \r\n (Sample 2)
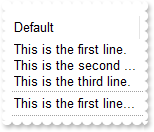
with thisform.Gantt1
	.BeginUpdate
	.DrawGridLines = -2
	.ColumnAutoResize = .F.
	.ScrollBySingleLine = .T.
	.Columns.Add("Default").Width = 128
	with .Items
		.DefaultItem = .AddItem("This is the first line.\r\nThis is the second line.\r\nThis is the third line.")
		.CellSingleLine(0,0) = 1
		.AddItem("This is the first line.\r\nThis is the second line.\r\nThis is the third line.")
	endwith
	.EndUpdate
endwith
|
|
954
|
Can I break the cell's caption using the line break <br> or \r\n (Sample 1)
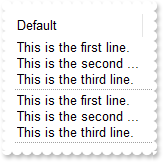
with thisform.Gantt1
	.BeginUpdate
	.DrawGridLines = -2
	.ColumnAutoResize = .F.
	.ScrollBySingleLine = .T.
	with .Columns.Add("Default")
		.Width = 128
		.Def(16) = 1
	endwith
	with .Items
		.AddItem("This is the first line.\r\nThis is the second line.\r\nThis is the third line.")
		.AddItem("This is the first line.\r\nThis is the second line.\r\nThis is the third line.")
	endwith
	.EndUpdate
endwith
|
|
953
|
How can I change the visual appearance/color of the Filter For ... field
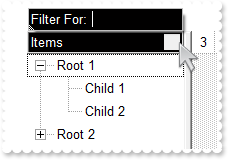
with thisform.Gantt1
	.BeginUpdate
	.LinesAtRoot = -1
	.BackColorHeader = RGB(1,0,0)
	.ForeColorHeader = RGB(255,255,255)
	.Object.Background(26) = .BackColorHeader
	.Object.Background(27) = .ForeColorHeader
	.Object.Background(0) = RGB(240,240,240)
	.Object.Background(32) = -1
	.HeaderAppearance = 5
	with .Columns.Add("Items")
		.FilterOnType = .T.
		.DisplayFilterButton = .T.
		.FilterList = 2
	endwith
	with .Items
		h = .AddItem("Root 1")
		.InsertItem(h,Null,"Child 1")
		.InsertItem(h,Null,"Child 2")
		.DefaultItem = h
		.ExpandItem(0) = .T.
		h = .AddItem("Root 2")
		.InsertItem(h,Null,"Child 1")
		.InsertItem(h,Null,"Child 2")
	endwith
	.EndUpdate
endwith
|
|
952
|
How can I display the cell's caption without spaces on both sides
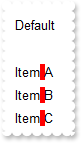
with thisform.Gantt1
	.BeginUpdate
	.ColumnAutoResize = .T.
	with .Columns.Add("Default")
		.Def(17) = 1
		.FormatColumn = "((trim(value) replace `   ` with ` `) replace `  ` with ` `) replace ` ` with `<bgcolor=FF0000> </bgcolor>`"
	endwith
	with .Items
		.AddItem("")
		.AddItem("Item A")
		.AddItem("    Item B")
		.AddItem("        Item   C    ")
	endwith
	.EndUpdate
endwith
|
|
951
|
How can I highlight the spaces within the column (sample 2)
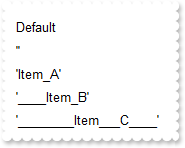
with thisform.Gantt1
	.BeginUpdate
	.ColumnAutoResize = .T.
	with .Columns.Add("Default")
		.Def(17) = 1
		.FormatColumn = "`'` + ( value replace ` ` with `_` ) + `'`"
	endwith
	with .Items
		.AddItem("")
		.AddItem("Item A")
		.AddItem("    Item B")
		.AddItem("        Item   C    ")
	endwith
	.EndUpdate
endwith
|
|
950
|
How can I highlight the spaces within the column (sample 1)
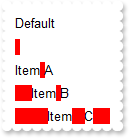
with thisform.Gantt1
	.BeginUpdate
	.ColumnAutoResize = .T.
	with .Columns.Add("Default")
		.Def(17) = 1
		.FormatColumn = "len(value) = 0 ? `<bgcolor=FF0000> </bgcolor>` : ( value replace ` ` with `<bgcolor=FF0000> </bgcolor>` )"
	endwith
	with .Items
		.AddItem("")
		.AddItem("Item A")
		.AddItem("    Item B")
		.AddItem("        Item   C    ")
	endwith
	.EndUpdate
endwith
|
|
949
|
How can I change the visual aspect of the drop down filter-calendar
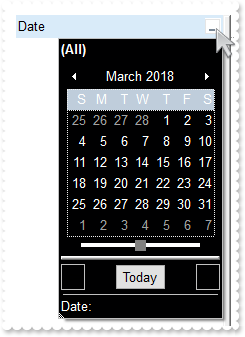
with thisform.Gantt1
	.BeginUpdate
	.Object.Background(26) = RGB(0,0,1)
	.Object.Background(27) = RGB(255,255,255)
	.Object.Background(12) = RGB(255,255,255)
	.Object.Background(8) = .Background(26)
	.Object.Background(11) = RGB(128,128,128)
	with .Columns.Add("Date")
		.FilterType = 4
		.DisplayFilterButton = .T.
		.DisplayFilterDate = .T.
		.DisplayFilterPattern = .F.
	endwith
	.EndUpdate
endwith
|
|
948
|
Export Data in HTML format
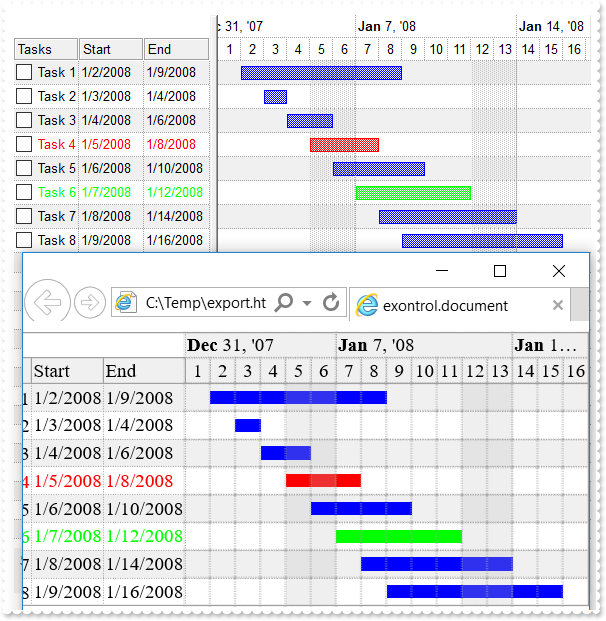
*** AddItem event - Occurs after a new Item has been inserted to Items collection. ***
LPARAMETERS Item
	with thisform.Gantt1
		with .Items
			i = .ItemToIndex(Item)
			.AddBar(Item,"Task",{^2008-1-2},{^2008-1-9},"")
			.DefaultItem = Item
			.ItemBar(0,"",514) = i
			.DefaultItem = Item
			.ItemBar(0,"",515) = i
			.DefaultItem = Item
			.CellCaption(0,1) = .ItemBar(Item,"",1)
			.DefaultItem = Item
			.CellCaption(0,2) = .ItemBar(Item,"",2)
		endwith
	endwith

with thisform.Gantt1
	.BeginUpdate
	.BackColorAlternate = RGB(240,240,240)
	.DrawGridLines = -1
	.HeaderAppearance = 4
	.Object.Description(11) = .FormatABC("`<fgcolor=808080> ` + value + ` </fgcolor>`",.Description(11))
	var_s = "(( ( value replace `[<b>` with `<bgcolor=000000><fgcolor=FFFFFF><b> ` replace `</b>]` with ` </b></bgcolor></fgcolor>` replace `"
	var_s = var_s + "[<s>` with `<bgcolor=C0C0C0><fgcolor=FFFFFF> ` replace `</s>]` with ` </fgcolor></bgcolor>` )  + `<r><fgcolor=808080>` + ( match"
	var_s = var_s + "itemcount < 0 ? ( ( len(value) ? `` : `` ) + `<r>` + abs(matchitemcount + 1) + ` result(s)` ) : (`<r><fgcolor=808080>`+ itemcoun"
	var_s = var_s + "t + ` item(s)`) )))"
	.FilterBarCaption = var_s
	.FilterBarPromptVisible = 2579 && FilterBarVisibleEnum.exFilterBarCompact Or FilterBarVisibleEnum.exFilterBarShowCloseIfRequired Or FilterBarVisibleEnum.exFilterBarSingleLine Or FilterBarVisibleEnum.exFilterBarVisible Or FilterBarVisibleEnum.exFilterBarPromptVisible
	.FilterBarPromptType = 2
	.DrawGridLines = -1
	with .Chart
		.DrawGridLines = -1
		.PaneWidth(0) = 196
		.LevelCount = 2
		.FirstVisibleDate = {^2008-1-1}
		.FirstWeekDay = 1
	endwith
	with .ConditionalFormats.Add("(%2 - %1) = 3","K3")
		.ForeColor = RGB(255,0,0)
		.BarColor = .ForeColor
		.ApplyToBars = "Task"
	endwith
	with .ConditionalFormats.Add("(%2 - %1) = 5","K5")
		.ForeColor = RGB(0,255,0)
		.BarColor = .ForeColor
		.ApplyToBars = "Task"
	endwith
	with .Columns
		.Add("Tasks").Def(0) = .T.
		.Add("Start")
		.Add("End")
	endwith
	with .Items
		.AddItem("Task 1")
		.AddItem("Task 2")
		.AddItem("Task 3")
		.AddItem("Task 4")
		.AddItem("Task 5")
		.AddItem("Task 6")
		.AddItem("Task 7")
		.AddItem("Task 8")
	endwith
	.EndUpdate
	sFile = "c:/temp/export.html"
	.Export(sFile,"vis")
	with CreateObject("InternetExplorer.Application")
		.Navigate2(sFile)
	endwith
endwith
|
|
947
|
Export Data in CSV format
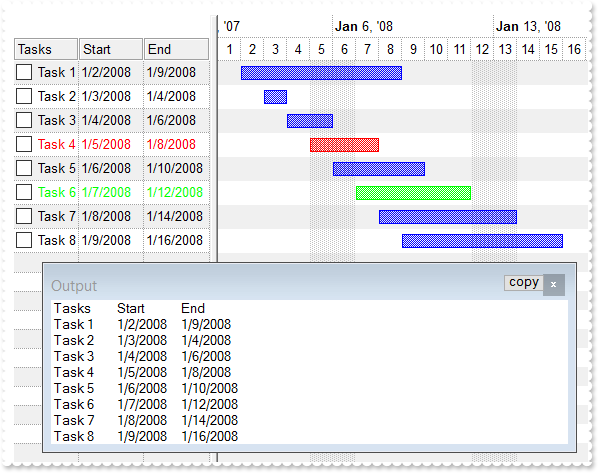
*** AddItem event - Occurs after a new Item has been inserted to Items collection. ***
LPARAMETERS Item
	with thisform.Gantt1
		with .Items
			i = .ItemToIndex(Item)
			.AddBar(Item,"Task",{^2008-1-2},{^2008-1-9},"")
			.DefaultItem = Item
			.ItemBar(0,"",514) = i
			.DefaultItem = Item
			.ItemBar(0,"",515) = i
			.DefaultItem = Item
			.CellCaption(0,1) = .ItemBar(Item,"",1)
			.DefaultItem = Item
			.CellCaption(0,2) = .ItemBar(Item,"",2)
		endwith
	endwith

with thisform.Gantt1
	.BeginUpdate
	.BackColorAlternate = RGB(240,240,240)
	.DrawGridLines = -1
	.HeaderAppearance = 4
	.Object.Description(11) = .FormatABC("`<fgcolor=808080> ` + value + ` </fgcolor>`",.Description(11))
	var_s = "(( ( value replace `[<b>` with `<bgcolor=000000><fgcolor=FFFFFF><b> ` replace `</b>]` with ` </b></bgcolor></fgcolor>` replace `"
	var_s = var_s + "[<s>` with `<bgcolor=C0C0C0><fgcolor=FFFFFF> ` replace `</s>]` with ` </fgcolor></bgcolor>` )  + `<r><fgcolor=808080>` + ( match"
	var_s = var_s + "itemcount < 0 ? ( ( len(value) ? `` : `` ) + `<r>` + abs(matchitemcount + 1) + ` result(s)` ) : (`<r><fgcolor=808080>`+ itemcoun"
	var_s = var_s + "t + ` item(s)`) )))"
	.FilterBarCaption = var_s
	.FilterBarPromptVisible = 2579 && FilterBarVisibleEnum.exFilterBarCompact Or FilterBarVisibleEnum.exFilterBarShowCloseIfRequired Or FilterBarVisibleEnum.exFilterBarSingleLine Or FilterBarVisibleEnum.exFilterBarVisible Or FilterBarVisibleEnum.exFilterBarPromptVisible
	.FilterBarPromptType = 2
	with .Chart
		.PaneWidth(0) = 196
		.LevelCount = 2
		.FirstVisibleDate = {^2008-1-1}
	endwith
	with .ConditionalFormats.Add("(%2 - %1) = 3","K3")
		.ForeColor = RGB(255,0,0)
		.BarColor = .ForeColor
		.ApplyToBars = "Task"
	endwith
	with .ConditionalFormats.Add("(%2 - %1) = 5","K5")
		.ForeColor = RGB(0,255,0)
		.BarColor = .ForeColor
		.ApplyToBars = "Task"
	endwith
	with .Columns
		.Add("Tasks").Def(0) = .T.
		.Add("Start")
		.Add("End")
	endwith
	with .Items
		.AddItem("Task 1")
		.AddItem("Task 2")
		.AddItem("Task 3")
		.AddItem("Task 4")
		.AddItem("Task 5")
		.AddItem("Task 6")
		.AddItem("Task 7")
		.AddItem("Task 8")
	endwith
	.EndUpdate
	DEBUGOUT( .Export("","vis") )
endwith
|
|
946
|
Is it possible to check multiple-items at once
*** AddItem event - Occurs after a new Item has been inserted to Items collection. ***
LPARAMETERS Item
	with thisform.Gantt1
		bHasParent = .FormatABC("value != 0",.Items.ItemParent(Item))
		with .Items
			.DefaultItem = Item
			.CellHasCheckBox(0,0) = bHasParent
		endwith
	endwith

with thisform.Gantt1
	.BeginUpdate
	.LinesAtRoot = -1
	with .Columns.Add("Tasks")
		.Def(17) = 1
		.FormatColumn = "value + (%CS0 = 1 ? `<r><fgcolor=808080>(checked)` : ``)"
	endwith
	.HeaderVisible = 1
	.SingleSel = .F.
	with .Items
		h = .AddItem("Project")
		hChild = .InsertItem(h,Null,"Task 1")
		hChild = .InsertItem(h,Null,"Task 2")
		hChild = .InsertItem(h,Null,"Task 3")
		.DefaultItem = h
		.ExpandItem(0) = .T.
		.LockedItemCount(0) = 1
		.DefaultItem = .LockedItem(0,0)
		.CellCaption(0,0) = "<c>Select multiple items and press the <b>SPACE</b> key"
	endwith
	.EndUpdate
endwith
|
|
945
|
How can I get the icon from the cell when using the Items.CellImages property (icon index)
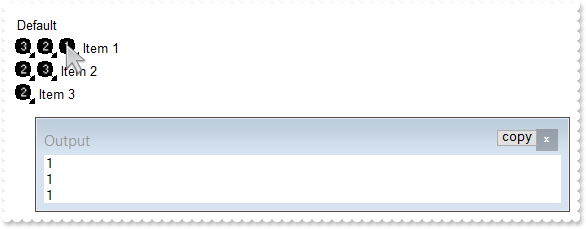
*** MouseMove event - Occurs when the user moves the mouse. ***
LPARAMETERS Button, Shift, X, Y
	with thisform.Gantt1
		i = .ItemFromPoint(-1,-1,c,hit)
		DEBUGOUT( .FormatABC("( 0x44 = ( value bitand 0x44 ) ) ? ( ( (value bitand 0xFFFF0000) bitshift 16 ) array B split `,` )  : `no image`",hit,.Items.CellImages(i,c)) )
	endwith

with thisform.Gantt1
	.BeginUpdate
	var_s = "gBJJgBAIDAAGAAEAAQhYAf8Pf4hh0QihCJo2AEZjQAjEZFEaIEaEEaAIAkcbk0olUrlktl0vmExmUzmk1m03nE5nU7nk9n0/oFBoVDolFo1HpFJpVLplNp1PqFRqVTql"
	var_s = var_s + "Vq1XrFZrVbrldr1fsFhsVjslls1ntFptVrtltt1vuFxuVzul1u13vF5vV7vl9v1/wGBwWDwmFw2HxGJxWLxmNx0xiFdyOTh8Tf9ZymXx+QytcyNgz8r0OblWjyWds+m0"
	var_s = var_s + "ka1Vf1ta1+r1mos2xrG2xeZ0+a0W0qOx3GO4NV3WeyvD2XJ5XL5nN51aiw+lfSj0gkUkAEllHanHI5j/cHg8EZf7w8vl8j4f/qfEZeB09/vjLAB30+kZQAP/P5/H6/yN"
	var_s = var_s + "AOAEAwCjMBwFAEDwJBMDwLBYAP2/8Hv8/gAGAD8LQs9w/nhDY/oygIA="
	.Images(var_s)
	.Chart.PaneWidth(1) = 0
	.Columns.Add("Default")
	with .Items
		.DefaultItem = .AddItem("Item 1")
		.CellImages(0,0) = "3,2,1"
		.DefaultItem = .AddItem("Item 2")
		.CellImages(0,0) = "2,3"
		.DefaultItem = .AddItem("Item 3")
		.CellImages(0,0) = "2,"
	endwith
	.EndUpdate
endwith
|
|
944
|
How can I get the icon from the cell when using the Items.CellImages property (icon position within the cell)
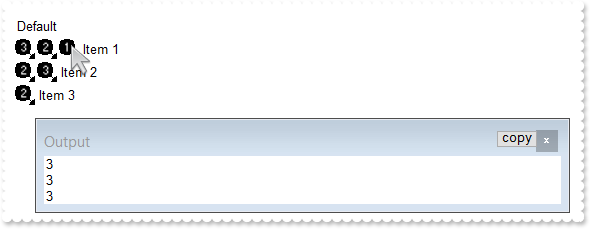
*** MouseMove event - Occurs when the user moves the mouse. ***
LPARAMETERS Button, Shift, X, Y
	with thisform.Gantt1
		i = .ItemFromPoint(-1,-1,c,hit)
		DEBUGOUT( .FormatABC("( 0x44 = ( value bitand 0x44 ) ) ? 1 + ( (value bitand 0xFFFF0000) bitshift 16 ) : `no image`",hit) )
	endwith

with thisform.Gantt1
	.BeginUpdate
	var_s = "gBJJgBAIDAAGAAEAAQhYAf8Pf4hh0QihCJo2AEZjQAjEZFEaIEaEEaAIAkcbk0olUrlktl0vmExmUzmk1m03nE5nU7nk9n0/oFBoVDolFo1HpFJpVLplNp1PqFRqVTql"
	var_s = var_s + "Vq1XrFZrVbrldr1fsFhsVjslls1ntFptVrtltt1vuFxuVzul1u13vF5vV7vl9v1/wGBwWDwmFw2HxGJxWLxmNx0xiFdyOTh8Tf9ZymXx+QytcyNgz8r0OblWjyWds+m0"
	var_s = var_s + "ka1Vf1ta1+r1mos2xrG2xeZ0+a0W0qOx3GO4NV3WeyvD2XJ5XL5nN51aiw+lfSj0gkUkAEllHanHI5j/cHg8EZf7w8vl8j4f/qfEZeB09/vjLAB30+kZQAP/P5/H6/yN"
	var_s = var_s + "AOAEAwCjMBwFAEDwJBMDwLBYAP2/8Hv8/gAGAD8LQs9w/nhDY/oygIA="
	.Images(var_s)
	.Chart.PaneWidth(1) = 0
	.Columns.Add("Default")
	with .Items
		.DefaultItem = .AddItem("Item 1")
		.CellImages(0,0) = "3,2,1"
		.DefaultItem = .AddItem("Item 2")
		.CellImages(0,0) = "2,3"
		.DefaultItem = .AddItem("Item 3")
		.CellImages(0,0) = "2"
	endwith
	.EndUpdate
endwith
|
|
943
|
Is it possible to change the visual appearance of the position signs when user changes the column's position by drag and drop
with thisform.Gantt1
	.BeginUpdate
	.HeaderAppearance = 4
	with .Columns
		.Add("Column 1")
		.Add("Column 2")
		.Add("Column 3")
	endwith
	with .VisualAppearance
		var_s = "gBFLBCJwBAEHhEJAAEhABZEGACAADACAxRDgMQBQKAAzAJBIYhiG4cYCgMYxXDOCYXABCEYRXBIZQ7BKNIxjSJwFgmEgADKMA4SOKIZhrE4bBhGaQRUgyI43RhHUBzVI"
		var_s = var_s + "UcQvE6TZRHCQYHgkNIhDJIM7TPLkeSVJaTIRoKhJUogApQThTMgVRDEThkGoSa6soSoYTDBKybLrSLKagOT5YUDKUqSdKEZRpEq1YztWbaQoCUoqVRRVIWfbNd4JJa4a"
		var_s = var_s + "DhWpYdpeeY5R7bWLgBYVVABL7LLRsSxpHxPF6RXxaeI3GKsaS8G6ic6nPQMHj7I4NS5pUa6Rh2VYNSa8AAtETRYznOw4bTMXAjNIea5bAYIIR5HIoDzVbQcCQAHL9DBe"
		var_s = var_s + "EMIQEEISgGhMGZQmocgymoYRRCIEQ0G2HYBnEIBig4V4zCQGINnmagCECY43medZ6H2Pw/g+X5fnueh/h+R5+AKABfkMWgGgGYA4AICoCGCE5WA4CphACMgSD2IRIDIB"
		var_s = var_s + "ICmEd5YGCBpRjGBgegWIYIgWdgoGIRQsiKCZiAiJZ0gGQI4jUS4LECOAiBmDJflGfg2BSY4Al4OhGkOCJ2DgFJjGGfgqgiH5Ch4RhGkqOQmEOEpkFkHQYhJRYyESAokG"
		var_s = var_s + "KHhIhKIxJEmf4VGUeRGFmF5iBkchPhYJQ5GoYIZg6Ug6GoFYmkmNhuhulRGHKGoImefh0BUZ4JmYeoemeSZ2H6HQmgoBgXDqXwUAQgI="
		.Add(1,var_s)
		.Add(2,"CP:1 0 -36 0 0")
	endwith
	.Object.Background(182) = 0x2000000
	.EndUpdate
endwith
|
|
942
|
A black portion is shown while I am using the BackColorAlternate with EBN colors. What can I do
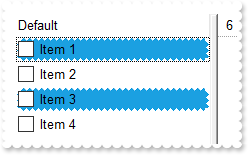
with thisform.Gantt1
	.BeginUpdate
	.ColumnAutoResize = .T.
	.DefaultItemHeight = 20
	var_s = "gBFLBCJwBAEHhEJAAEhIDhAxHAxg0HG0Mg4xGI3HMOig3GcJiYAf8jAEhhUnAAyhEqg8hk0oAsIjgAiAwmYxGA4mYzGwwkI0i0ooUnB0IBMIl1Dg8zmYyGolptPkI1mY"
	var_s = var_s + "1GAll9KoUslNIrVCqNQldShFUstXAVfrVcrlZtVhuFnsUHq1zoczoQGhFBkNpg6zbDykUkhsPHE2h85nc9n8xtVDtlex9Msd2p1YstVq9ux8HyMtzuFz1PsNTzQlv2hh"
	var_s = var_s + "WfkuqpeVuN0q+nvEooN5veSAGpkb/ACcZrvhU3w83nM/poxGuchGpoVBvWgg+8knA4WimnFxI45Er5XOlHMg/Q3XU33W4ew9Wyu11mchDagcO7zus8VDoNBBEIKBpMY6"
	var_s = var_s + "DqOQyokhA/IQIQmwMk4bIQFDcoO6LWgwhQkNcABwEyAB5GwWbet6cRQg3DENQ5D8QxADZvEkAB8nabsURGeBpFM3pwE2AEZRpDx/neZpOR3Dz9oO/r/wCMoZNTBQAQRJ"
	var_s = var_s + "SEwYg8HPGhEIoNCaEwq10gQ2WcRt7LcRxRFpuxUAEURQ3sczBEMgTTG8gN7HpOSEAEiQBAQZpmQ0DibPUFwbKcHwkhQoQtNQNzNEMbABOKDy/DMYQzHLeoPL0OTJSUd0"
	var_s = var_s + "pHcxTewk5zrIygIRPslz4lEngBKIAQivgASs/kLSBTlO00f8t0vGcgUbDlDRjXLCUNRERRvRgAHW2oAICA=="
	.VisualAppearance.Add(1,var_s)
	with .Columns.Add("Default")
		.Def(0) = .T.
		.PartialCheck = .T.
	endwith
	with .Columns.Add("Position")
		.FormatColumn = "1 rindex ``"
		.Visible = .F.
	endwith
	with .ConditionalFormats.Add("%C1 mod 2")
		.BackColor = 0x1000000
	endwith
	with .Items
		.AddItem("Item 1")
		.AddItem("Item 2")
		.AddItem("Item 3")
		.AddItem("Item 4")
	endwith
	.EndUpdate
endwith
|
|
941
|
How can I specify alternate background colors for each root item, similar with BackColorAlternate
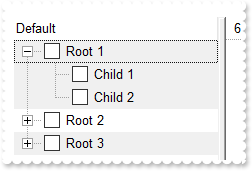
with thisform.Gantt1
	.BeginUpdate
	.LinesAtRoot = -1
	with .Columns.Add("Default")
		.Def(0) = .T.
		.PartialCheck = .T.
	endwith
	with .Columns.Add("Position")
		.FormatColumn = "( ( 1:=( ( 0:=(1 rpos '') ) lfind `.`) ) < 0 ? =:0 : (=:0 left =:1) )"
		.Visible = .F.
	endwith
	with .ConditionalFormats.Add("%C1 mod 2")
		.BackColor = RGB(240,240,240)
	endwith
	with .Items
		h = .AddItem("Root 1")
		.InsertItem(h,Null,"Child 1")
		.InsertItem(h,Null,"Child 2")
		.DefaultItem = h
		.ExpandItem(0) = .T.
		h = .AddItem("Root 2")
		.InsertItem(h,Null,"Child 1")
		.InsertItem(h,Null,"Child 2")
		h = .AddItem("Root 3")
		.InsertItem(h,Null,"Child 1")
		.InsertItem(h,Null,"Child 2")
	endwith
	.EndUpdate
endwith
|
|
940
|
How can I change the visual appearance of the +/- buttons, open/close glyphs as current visual theme (method 4)
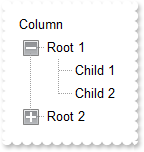
with thisform.Gantt1
	.BeginUpdate
	.LinesAtRoot = -1
	var_s = "gBFLBWIgBAEHhEJAEGg6VAkHeLpgwChAOhULB8XAUUg8MAAREEHGMcgRCJ0ei8dhABDEcQAAYAQGKIYBkAKBQAGaAoDDMOQwQwAAxjGKEEwsACEIrjKCRShyCYZRhGcT"
	var_s = var_s + "SBCIZBqEqSZLiEZRQiiCYsS5GQBRWAkEwiBiEQTjea5CgOIAFS7LIqjRQEBxhIaZYIGaiQADENo9TxIMZAfBIHShK6NJABCCSQKkYx0HScRijDIEFwGIQmbKiej4DCiC"
	var_s = var_s + "QQW7OYYRVCNMQSfa8HivJyrcamfp/YBgOBYHb1eLVPR5LwfPCGUw1P6PLxkORZHimK4tSLHV7xVpMIwZFafIQhCCoHomS5NU7UNR0TQUFx9FaGX7rDDsGwLAJ6XRgF4b"
	var_s = var_s + "g2VpnHePpenAN4bH2GwHFmApSjEGBLnWOpRGOTBZHOegrE6BxPiWVJqCweQrn0LgJAWJBjwgaw1gKO5HmWch5h+fovF+G5bmich4BgfZkB8dynRUVYqiUR5rnmex/F6N"
	var_s = var_s + "4tn2AJfnebZ3DEXw3HWXgzAyIwgicKJKBKEIhCeCgiHyHYFEmSAFmqBghFIdgSCeIJygYDAyAgJx6AoIINAMOJNCgCZCGoGoLmMCI+CwJoihMNglCCIhzFCUg0EmMhgh"
	var_s = var_s + "WDBkAiQg9CUY4jEYN4Jk2IxklYJoJHIUg+CSZJSESFwkkkGI+FOFIJEIRhPhMCRJCSVoRrSBhiDgTZjHYT4PEkYhwhgJYm0SaIaiaSYuE+GQNlmCIBGCJxjhiZQ5AkMh"
	var_s = var_s + "Ag6ExJCkPhPguaAiFYUAlAkKZ0g6HoOEmWR/GHcA4m0OwIlIJIHCRgQshGJhpjoaocieaZiC6GAimkUgehIOwnGYGYIGkah6jaE4rg6SpCjKK5rEOMYlGIGIihKOgglo"
	var_s = var_s + "Foqj6L5aGaBo6CkGIkAQjiPpCAAaJILCTJQlKPACDaXJgmSaJsnCdJ4nygKEoijKQpSmKcqCpKoqysK0rivLAsSyLMtC1LYty4Lkui7LwvS+L8wDBMIwzEMUxjHMgyTK"
	var_s = var_s + "MszDNM4zzQNE0jTNQ1TWNc2DZNo2zcN03jfOA4TiOM5DlOY5zoOk6jrOw7TuO88DxPI8z0PU9j3Pg+T6Ps/D9P4/0AQFAkDQRBUGQdCEJQpC0MQ1DkPRBEUSRNFEVBhF"
	var_s = var_s + "kXRhGQ9D6Dxfh+W5gGGd4QH2XQjCmDpFFaKoVB+D5Xmed5+H8YAHnIAh9EwV5Fl0d4MkMKJICmSgygSJAoEmMUCIPgnDCCIOQFYCxJjwFoCcA4kxoF+AIJkAgExegDEg"
	var_s = var_s + "EYQInAzCUAIOEGgfxiiRDYF1Q4EQ2BSCaEQYwbAiKREMpRSymFNDIAkAxT6oVRgSA2qdVKq1WqvVirMZQUhSCnBUMoIgoQRgnGSIQUgkg1hIHYAkAYMROAmHiLsE4xxS"
	var_s = var_s + "CxBwEwCQ0wmDdBsE0GYXBtg2CSPMFIuwYiQBYBQeAcwOCnBCCZgw0g0glBONAQgqQThCGgPQGoBQfiRGmOEZIPAXjsBoPAO4HRThhA0EQSA5BAgaCKJIGg3QdhOCmNUB"
	var_s = var_s + "oQAijTCIF0FwQxpCHDIPAYYMQGgtCmFcaQtRAjZCyFYSojQ2B2BoKwIYFApBXEIBsIQ1QsAWAWEwaA1xCgjAoIAQBAQ="
	.VisualDesign = var_s
	.Columns.Add("Column")
	with .Items
		h = .AddItem("Root 1")
		.InsertItem(h,Null,"Child 1")
		.InsertItem(h,Null,"Child 2")
		.DefaultItem = h
		.ExpandItem(0) = .T.
		h = .AddItem("Root 2")
		.InsertItem(h,Null,"Child")
	endwith
	.EndUpdate
endwith
|
|
939
|
How can I change the visual appearance of the +/- buttons, open/close glyphs as current visual theme (method 3)
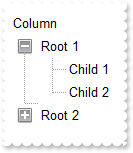
with thisform.Gantt1
	.BeginUpdate
	with .VisualAppearance
		var_s = "gBFLBCJwBAEHhEJAAEhABDwCg6AADACAxRDgMQBQKAAzAJBIYhiG4cYCgMZhXDOCYXABCEYRXBIZQ7BKNIxjSJ5BhIAAyDSJMjSRJUEhqGCWYDleYYYAKHIMQLJQKQSB"
		var_s = var_s + "cQR9EaBZBAWTpQC0OJDTJRI4TNAgbSYAAYRqoCb6loTKypaxjCQQIgkUBpGKdBynEYsDwSGyJCCJWyIbpKAwoVbcs4AYhuJpaQi+d5PFbjVT8dLAMBwLA8EwXAJ+OpfD"
		var_s = var_s + "xXU7eFKpR5fchXTI8UxXFqXZhkeQrfh7KYVRBKdBQRBEFQPJqnahqOpaXo2RoLUJKcQwHTmHYNQTALyuTALZrWeZ3XrgN74LbtZzVQauYRpbCMEr6bpoWLnFi6Ho1U4l"
		var_s = var_s + "lWah1jqSweFqfxPgQQRphi+Yak0YIuqUfJegef4zluaJ3nqPJeCYH4BAeX5TDLBpVGqKRRnwf4flefZtHsX54BYAR/F+EwVnUd5eAMMJKDIChygyIQpAoEh4iIJ5JlgX"
		var_s = var_s + "IcgCXpIGoFwnGEQh6BEKBgmMIICHgIJCAiUAzgyUoAhwJohkiRgygwYpiGoKwzGIcgKCkNQNCMRIbCYCRYk4QoMiOchWDwNBjhiJJaDYTRiGiFwlCQAhOE8JBJHITIRg"
		var_s = var_s + "wZRZFCFCZBkOIUhKTRpCWAwgGYQ4El4NxlBifIWCcCYCFoaoMGaKYyG6GxlBmGJdhkCAWBIeA5g4U4QhMJAImkPIShRVxGgQJRlCIUISh+SJpnCZIeBgFgiHgO4OlOMI"
		var_s = var_s + "NCISByECDQikkGhuh2JwpmqBogCKaYiC6FwhmkQ4yHgYgYiaHopiuaRakCbIsisSpGjYOwaHYKYMCkK5CA2IxrCwCwFigaJrkLTI6lcdANAEgIA="
		.Add(3,var_s)
		.Add(1,"CP:3 -2 -2 2 2")
		var_s1 = "gBFLBCJwBAEHhEJAAEhABEICg6AADACAxRDgMQBQKAAzAJBIYhiG4cYCgMZhXDOCYXABCEYRXBIZQ7BKNIxjSJ5BhIAAyDSJMjSRJUEhqGCWYDleYYYAKHIMQLJQKQSB"
		var_s1 = var_s1 + "cQR9EaBZBAWTpQC0OJDTJRI4TNAgbSYAAYRqoCb6loTKypaxjCQQIgkUBpGKdBynEYsDwSGyJCCJWyIbpKAwoVbcs4AYhuJpaQi+d5PFbjVT8dLAMBwLA8EwXAJ+OpfD"
		var_s1 = var_s1 + "xXU7eFKpR5fchXTI8UxXFqXZhkeQrfh7KYVRBKdBQRBEFQPJqnahqOpaXo2RoLUJKcQwHTmHYNQTALyuTALZrWeZ3XrgN74LbtZzVQauYRpbCMEr6bpoWLnFi6Ho1U4l"
		var_s1 = var_s1 + "lWah1jqSweFqfxPgQQRphi+Yak0YIuqUfJeg8X4rluaZ3niGB+AQHx/EyShjjEVYqiUR5rnmex/GAB5+AIf4gEeXJFHyXZ3gCTAygyAociMKBKEKBIeCiCZyHYFAnCEe"
		var_s1 = var_s1 + "Bkh+BghFgRIegOCgYCySAgh4CAkgINAMmMNIgCcCYjn4LoLmMCJGDKC5ijIagoDMYhCAoJg1A0IxEhsJgJFiThChCY5yFYPA0GOGIYloNhNGIaIXCUJACE4TwkEkchOF"
		var_s1 = var_s1 + "SFYlFkXhUCUCQZEYTglCSMxaEkYJIBmFJhDeDZZEYPwlgmQhghaGqVDoa4bGaeY6FGGZNlmFIBGEJ4jhiZQ5AkMhAg6E5JCkRoGCUSQ6B6CYiSCBIOh+DhJmmARiWQOJ"
		var_s1 = var_s1 + "tDsCJSCSBwkXSLIRicaZ6HqIIomoIguhwIpphIHoWDsJ4mCGChpmqOpGheLIOkqUo2iya4DjGJxihiQoSj4IJaDaMpCjCWoGg6PgpBiQ4tHcQJQBAgI="
		.Add(4,var_s1)
		.Add(2,"CP:4 -2 -2 2 2")
	endwith
	.LinesAtRoot = 1
	.HasButtons = 4
	.Object.HasButtonsCustom(0) = 16777216
	.Object.HasButtonsCustom(1) = 33554432
	.Columns.Add("Column")
	with .Items
		h = .AddItem("Root 1")
		.InsertItem(h,Null,"Child 1")
		.InsertItem(h,Null,"Child 2")
		.DefaultItem = h
		.ExpandItem(0) = .T.
		h = .AddItem("Root 2")
		.InsertItem(h,Null,"Child")
	endwith
	.EndUpdate
endwith
|
|
938
|
How can I change the visual appearance of the +/- buttons, open/close glyphs as current visual theme (method 2)
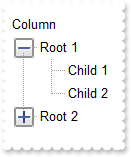
with thisform.Gantt1
	.BeginUpdate
	with .VisualAppearance
		.Add(1,"XP:TREEVIEW 2 1")
		.Add(2,"XP:TREEVIEW 2 2")
	endwith
	.Object.Background(180) = 0x1000000
	.Object.Background(181) = 0x2000000
	.LinesAtRoot = -1
	.Columns.Add("Column")
	with .Items
		h = .AddItem("Root 1")
		.InsertItem(h,Null,"Child 1")
		.InsertItem(h,Null,"Child 2")
		.DefaultItem = h
		.ExpandItem(0) = .T.
		h = .AddItem("Root 2")
		.InsertItem(h,Null,"Child")
	endwith
	.EndUpdate
endwith
|
|
937
|
How can I find if the control is running in DPI mode
with thisform.Gantt1
	DEBUGOUT( .FormatABC("dpi = 1 ? `normal/stretch mode` : `dpi mode`") )
endwith
|
|
936
|
How can I change the visual appearance of the +/- buttons (method 1)
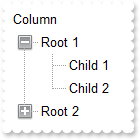
with thisform.Gantt1
	.BeginUpdate
	with .VisualAppearance
		var_s = "gBFLBCJwBAEHhEJAAEhABDwCg6AADACAxRDgMQBQKAAzAJBIYhiG4cYCgMZhXDOCYXABCEYRXBIZQ7BKNIxjSJ5BhIAAyDSJMjSRJUEhqGCWYDleYYYAKHIMQLJQKQSB"
		var_s = var_s + "cQR9EaBZBAWTpQC0OJDTJRI4TNAgbSYAAYRqoCb6loTKypaxjCQQIgkUBpGKdBynEYsDwSGyJCCJWyIbpKAwoVbcs4AYhuJpaQi+d5PFbjVT8dLAMBwLA8EwXAJ+OpfD"
		var_s = var_s + "xXU7eFKpR5fchXTI8UxXFqXZhkeQrfh7KYVRBKdBQRBEFQPJqnahqOpaXo2RoLUJKcQwHTmHYNQTALyuTALZrWeZ3XrgN74LbtZzVQauYRpbCMEr6bpoWLnFi6Ho1U4l"
		var_s = var_s + "lWah1jqSweFqfxPgQQRphi+Yak0YIuqUfJegef4zluaJ3nqPJeCYH4BAeX5TDLBpVGqKRRnwf4flefZtHsX54BYAR/F+EwVnUd5eAMMJKDIChygyIQpAoEh4iIJ5JlgX"
		var_s = var_s + "IcgCXpIGoFwnGEQh6BEKBgmMIICHgIJCAiUAzgyUoAhwJohkiRgygwYpiGoKwzGIcgKCkNQNCMRIbCYCRYk4QoMiOchWDwNBjhiJJaDYTRiGiFwlCQAhOE8JBJHITIRg"
		var_s = var_s + "wZRZFCFCZBkOIUhKTRpCWAwgGYQ4El4NxlBifIWCcCYCFoaoMGaKYyG6GxlBmGJdhkCAWBIeA5g4U4QhMJAImkPIShRVxGgQJRlCIUISh+SJpnCZIeBgFgiHgO4OlOMI"
		var_s = var_s + "NCISByECDQikkGhuh2JwpmqBogCKaYiC6FwhmkQ4yHgYgYiaHopiuaRakCbIsisSpGjYOwaHYKYMCkK5CA2IxrCwCwFigaJrkLTI6lcdANAEgIA="
		.Add(1,var_s)
		var_s1 = "gBFLBCJwBAEHhEJAAEhABEICg6AADACAxRDgMQBQKAAzAJBIYhiG4cYCgMZhXDOCYXABCEYRXBIZQ7BKNIxjSJ5BhIAAyDSJMjSRJUEhqGCWYDleYYYAKHIMQLJQKQSB"
		var_s1 = var_s1 + "cQR9EaBZBAWTpQC0OJDTJRI4TNAgbSYAAYRqoCb6loTKypaxjCQQIgkUBpGKdBynEYsDwSGyJCCJWyIbpKAwoVbcs4AYhuJpaQi+d5PFbjVT8dLAMBwLA8EwXAJ+OpfD"
		var_s1 = var_s1 + "xXU7eFKpR5fchXTI8UxXFqXZhkeQrfh7KYVRBKdBQRBEFQPJqnahqOpaXo2RoLUJKcQwHTmHYNQTALyuTALZrWeZ3XrgN74LbtZzVQauYRpbCMEr6bpoWLnFi6Ho1U4l"
		var_s1 = var_s1 + "lWah1jqSweFqfxPgQQRphi+Yak0YIuqUfJeg8X4rluaZ3niGB+AQHx/EyShjjEVYqiUR5rnmex/GAB5+AIf4gEeXJFHyXZ3gCTAygyAociMKBKEKBIeCiCZyHYFAnCEe"
		var_s1 = var_s1 + "Bkh+BghFgRIegOCgYCySAgh4CAkgINAMmMNIgCcCYjn4LoLmMCJGDKC5ijIagoDMYhCAoJg1A0IxEhsJgJFiThChCY5yFYPA0GOGIYloNhNGIaIXCUJACE4TwkEkchOF"
		var_s1 = var_s1 + "SFYlFkXhUCUCQZEYTglCSMxaEkYJIBmFJhDeDZZEYPwlgmQhghaGqVDoa4bGaeY6FGGZNlmFIBGEJ4jhiZQ5AkMhAg6E5JCkRoGCUSQ6B6CYiSCBIOh+DhJmmARiWQOJ"
		var_s1 = var_s1 + "tDsCJSCSBwkXSLIRicaZ6HqIIomoIguhwIpphIHoWDsJ4mCGChpmqOpGheLIOkqUo2iya4DjGJxihiQoSj4IJaDaMpCjCWoGg6PgpBiQ4tHcQJQBAgI="
		.Add(2,var_s1)
	endwith
	.LinesAtRoot = -1
	.Object.Background(180) = 0x1000000
	.Object.Background(181) = 0x2000000
	.Columns.Add("Column")
	with .Items
		h = .AddItem("Root 1")
		.InsertItem(h,Null,"Child 1")
		.InsertItem(h,Null,"Child 2")
		.DefaultItem = h
		.ExpandItem(0) = .T.
		h = .AddItem("Root 2")
		.InsertItem(h,Null,"Child")
	endwith
	.EndUpdate
endwith
|
|
935
|
How can I display the control's filter bar in the Items section only, as it was displayed before
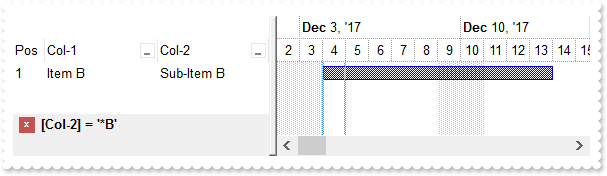
*** AddItem event - Occurs after a new Item has been inserted to Items collection. ***
LPARAMETERS Item
	with thisform.Gantt1
		.Items.AddBar(Item,"Task",{^2017-12-4},{^2017-12-14})
	endwith

with thisform.Gantt1
	.BeginUpdate
	with .Chart
		.LevelCount = 2
		.FirstVisibleDate = {^2017-12-2}
		.PaneWidth(0) = 256
	endwith
	with .Columns.Add("Col-1")
		.DisplayFilterButton = .T.
		.FilterList = 9504 && FilterListEnum.exShowExclude Or FilterListEnum.exShowFocusItem Or FilterListEnum.exShowCheckBox Or FilterListEnum.exSortItemsAsc
	endwith
	with .Columns.Add("Col-2")
		.DisplayFilterButton = .T.
		.FilterList = 9504 && FilterListEnum.exShowExclude Or FilterListEnum.exShowFocusItem Or FilterListEnum.exShowCheckBox Or FilterListEnum.exSortItemsAsc
	endwith
	with .Columns.Add("Pos")
		.AllowSizing = .F.
		.AllowSort = .F.
		.Width = 32
		.FormatColumn = "1 apos ``"
		.Position = 0
	endwith
	with .Items
		.DefaultItem = .AddItem("Item A")
		.CellCaption(0,1) = "Sub-Item A"
		.DefaultItem = .AddItem("Item B")
		.CellCaption(0,1) = "Sub-Item B"
		.DefaultItem = .AddItem("Item C")
		.CellCaption(0,1) = "Sub-Item C"
	endwith
	.FilterBarPromptVisible = 4096
	with .Columns.Item(1)
		.FilterType = 3
		.Filter = "*B"
	endwith
	.ApplyFilter
	.EndUpdate
endwith
|
|
934
|
FilterBarCaption ALL Keyword ( sample 2, result )
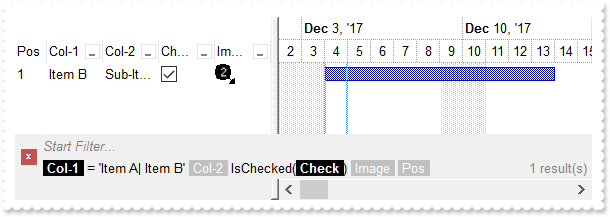
*** AddItem event - Occurs after a new Item has been inserted to Items collection. ***
LPARAMETERS Item
	with thisform.Gantt1
		i = .FormatABC("value + 1",.Items.ItemToIndex(Item))
		.DefaultItem = Item
		.Items.CellImage(0,3) = i
		.Items.AddBar(Item,"Task",{^2017-12-4},{^2017-12-14})
	endwith

with thisform.Gantt1
	.BeginUpdate
	with .Chart
		.LevelCount = 2
		.FirstVisibleDate = {^2017-12-2}
		.PaneWidth(0) = 256
	endwith
	var_s = "gBJJgBAIDAAGAAEAAQhYAf8Pf4hh0QihCJo2AEZjQAjEZFEaIEaEEaAIAkcbk0olUrlktl0vmExmUzmk1m03nE5nU7nk9n0/oFBoVDolFo1HpFJpVLplNp1PqFRqVTql"
	var_s = var_s + "Vq1XrFZrVbrldr1fsFhsVjslls1ntFptVrtltt1vuFxuVzul1u13vF5vV7vl9v1/wGBwWDwmFw2HxGJxWLxmNx0xiFdyOTh8Tf9ZymXx+QytcyNgz8r0OblWjyWds+m0"
	var_s = var_s + "ka1Vf1ta1+r1mos2xrG2xeZ0+a0W0qOx3GO4NV3WeyvD2XJ5XL5nN51aiw+lfSj0gkUkAEllHanHI5j/cHg8EZf7w8vl8j4f/qfEZeB09/vjLAB30+kZQAP/P5/H6/yN"
	var_s = var_s + "AOAEAwCjMBwFAEDwJBMDwLBYAP2/8Hv8/gAGAD8LQs9w/nhDY/oygIA="
	.Images(var_s)
	with .Columns.Add("Col-1")
		.DisplayFilterButton = .T.
		.FilterList = 9504 && FilterListEnum.exShowExclude Or FilterListEnum.exShowFocusItem Or FilterListEnum.exShowCheckBox Or FilterListEnum.exSortItemsAsc
	endwith
	with .Columns.Add("Col-2")
		.DisplayFilterButton = .T.
		.FilterList = 9504 && FilterListEnum.exShowExclude Or FilterListEnum.exShowFocusItem Or FilterListEnum.exShowCheckBox Or FilterListEnum.exSortItemsAsc
	endwith
	with .Columns.Add("Check")
		.Def(0) = .T.
		.DisplayFilterButton = .T.
		.DisplayFilterPattern = .F.
		.FilterType = 6
	endwith
	with .Columns.Add("Image")
		.DisplayFilterButton = .T.
		.FilterType = 10
		.FilterList = 9472 && FilterListEnum.exShowExclude Or FilterListEnum.exShowFocusItem Or FilterListEnum.exShowCheckBox
	endwith
	with .Columns.Add("Pos")
		.AllowSizing = .F.
		.AllowSort = .F.
		.Width = 32
		.FormatColumn = "1 apos ``"
		.Position = 0
	endwith
	with .Items
		.DefaultItem = .AddItem("Item A")
		.CellCaption(0,1) = "Sub-Item A"
		h = .AddItem("Item B")
		.DefaultItem = h
		.CellCaption(0,1) = "Sub-Item B"
		.DefaultItem = h
		.CellState(0,2) = 1
		.DefaultItem = .AddItem("Item C")
		.CellCaption(0,1) = "Sub-Item C"
	endwith
	.FilterBarFont = .Font
	.Object.Description(11) = .FormatABC("`<fgcolor=808080> ` + value + ` </fgcolor>`",.Description(11))
	var_s1 = "(( ( all replace `[<b>` with `<bgcolor=000000><fgcolor=FFFFFF><b> ` replace `</b>]` with ` </b></bgcolor></fgcolor>` replace `[<"
	var_s1 = var_s1 + "s>` with `<bgcolor=C0C0C0><fgcolor=FFFFFF> ` replace `</s>]` with ` </fgcolor></bgcolor>` )  + `<r><fgcolor=808080>` + ( matchit"
	var_s1 = var_s1 + "emcount < 0 ? ( ( len(value) ? `` : `` ) + `<r>` + abs(matchitemcount + 1) + ` result(s)` ) : (`<r><fgcolor=808080>`+ itemcount "
	var_s1 = var_s1 + "+ ` item(s)`) )))"
	.FilterBarCaption = var_s1
	.FilterBarPromptVisible = 3 && FilterBarVisibleEnum.exFilterBarVisible Or FilterBarVisibleEnum.exFilterBarPromptVisible
	with .Columns.Item(0)
		.FilterType = 240
		.Filter = "Item A|Item B"
	endwith
	.Columns.Item(2).Filter = 1
	.ApplyFilter
	.EndUpdate
endwith
|
|
933
|
FilterBarCaption ALL Keyword ( sample 1 )
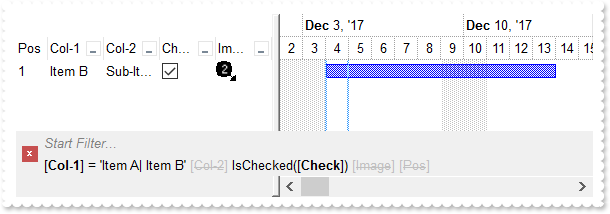
*** AddItem event - Occurs after a new Item has been inserted to Items collection. ***
LPARAMETERS Item
	with thisform.Gantt1
		i = .FormatABC("value + 1",.Items.ItemToIndex(Item))
		.DefaultItem = Item
		.Items.CellImage(0,3) = i
		.Items.AddBar(Item,"Task",{^2017-12-4},{^2017-12-14})
	endwith

with thisform.Gantt1
	.BeginUpdate
	with .Chart
		.LevelCount = 2
		.FirstVisibleDate = {^2017-12-2}
		.PaneWidth(0) = 256
	endwith
	var_s = "gBJJgBAIDAAGAAEAAQhYAf8Pf4hh0QihCJo2AEZjQAjEZFEaIEaEEaAIAkcbk0olUrlktl0vmExmUzmk1m03nE5nU7nk9n0/oFBoVDolFo1HpFJpVLplNp1PqFRqVTql"
	var_s = var_s + "Vq1XrFZrVbrldr1fsFhsVjslls1ntFptVrtltt1vuFxuVzul1u13vF5vV7vl9v1/wGBwWDwmFw2HxGJxWLxmNx0xiFdyOTh8Tf9ZymXx+QytcyNgz8r0OblWjyWds+m0"
	var_s = var_s + "ka1Vf1ta1+r1mos2xrG2xeZ0+a0W0qOx3GO4NV3WeyvD2XJ5XL5nN51aiw+lfSj0gkUkAEllHanHI5j/cHg8EZf7w8vl8j4f/qfEZeB09/vjLAB30+kZQAP/P5/H6/yN"
	var_s = var_s + "AOAEAwCjMBwFAEDwJBMDwLBYAP2/8Hv8/gAGAD8LQs9w/nhDY/oygIA="
	.Images(var_s)
	with .Columns.Add("Col-1")
		.DisplayFilterButton = .T.
		.FilterList = 9504 && FilterListEnum.exShowExclude Or FilterListEnum.exShowFocusItem Or FilterListEnum.exShowCheckBox Or FilterListEnum.exSortItemsAsc
	endwith
	with .Columns.Add("Col-2")
		.DisplayFilterButton = .T.
		.FilterList = 9504 && FilterListEnum.exShowExclude Or FilterListEnum.exShowFocusItem Or FilterListEnum.exShowCheckBox Or FilterListEnum.exSortItemsAsc
	endwith
	with .Columns.Add("Check")
		.Def(0) = .T.
		.DisplayFilterButton = .T.
		.DisplayFilterPattern = .F.
		.FilterType = 6
	endwith
	with .Columns.Add("Image")
		.DisplayFilterButton = .T.
		.FilterType = 10
		.FilterList = 9472 && FilterListEnum.exShowExclude Or FilterListEnum.exShowFocusItem Or FilterListEnum.exShowCheckBox
	endwith
	with .Columns.Add("Pos")
		.AllowSizing = .F.
		.AllowSort = .F.
		.Width = 32
		.FormatColumn = "1 apos ``"
		.Position = 0
	endwith
	with .Items
		.DefaultItem = .AddItem("Item A")
		.CellCaption(0,1) = "Sub-Item A"
		h = .AddItem("Item B")
		.DefaultItem = h
		.CellCaption(0,1) = "Sub-Item B"
		.DefaultItem = h
		.CellState(0,2) = 1
		.DefaultItem = .AddItem("Item C")
		.CellCaption(0,1) = "Sub-Item C"
	endwith
	.FilterBarFont = .Font
	.Object.Description(11) = .FormatABC("`<fgcolor=808080> ` + value + ` </fgcolor>`",.Description(11))
	.FilterBarCaption = "all"
	.FilterBarPromptVisible = 3 && FilterBarVisibleEnum.exFilterBarVisible Or FilterBarVisibleEnum.exFilterBarPromptVisible
	with .Columns.Item(0)
		.FilterType = 240
		.Filter = "Item A|Item B"
	endwith
	.Columns.Item(2).Filter = 1
	.ApplyFilter
	.EndUpdate
endwith
|
|
932
|
FilterBarCaption ALLUI Keyword ( sample 2, result )
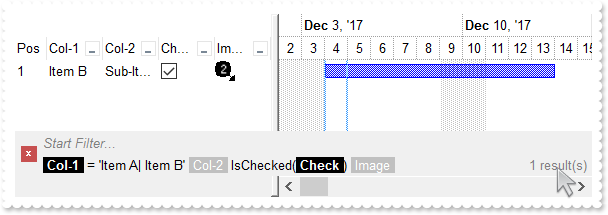
*** AddItem event - Occurs after a new Item has been inserted to Items collection. ***
LPARAMETERS Item
	with thisform.Gantt1
		i = .FormatABC("value + 1",.Items.ItemToIndex(Item))
		.DefaultItem = Item
		.Items.CellImage(0,3) = i
		.Items.AddBar(Item,"Task",{^2017-12-4},{^2017-12-14})
	endwith

with thisform.Gantt1
	.BeginUpdate
	with .Chart
		.LevelCount = 2
		.FirstVisibleDate = {^2017-12-2}
		.PaneWidth(0) = 256
	endwith
	var_s = "gBJJgBAIDAAGAAEAAQhYAf8Pf4hh0QihCJo2AEZjQAjEZFEaIEaEEaAIAkcbk0olUrlktl0vmExmUzmk1m03nE5nU7nk9n0/oFBoVDolFo1HpFJpVLplNp1PqFRqVTql"
	var_s = var_s + "Vq1XrFZrVbrldr1fsFhsVjslls1ntFptVrtltt1vuFxuVzul1u13vF5vV7vl9v1/wGBwWDwmFw2HxGJxWLxmNx0xiFdyOTh8Tf9ZymXx+QytcyNgz8r0OblWjyWds+m0"
	var_s = var_s + "ka1Vf1ta1+r1mos2xrG2xeZ0+a0W0qOx3GO4NV3WeyvD2XJ5XL5nN51aiw+lfSj0gkUkAEllHanHI5j/cHg8EZf7w8vl8j4f/qfEZeB09/vjLAB30+kZQAP/P5/H6/yN"
	var_s = var_s + "AOAEAwCjMBwFAEDwJBMDwLBYAP2/8Hv8/gAGAD8LQs9w/nhDY/oygIA="
	.Images(var_s)
	with .Columns.Add("Col-1")
		.DisplayFilterButton = .T.
		.FilterList = 9504 && FilterListEnum.exShowExclude Or FilterListEnum.exShowFocusItem Or FilterListEnum.exShowCheckBox Or FilterListEnum.exSortItemsAsc
	endwith
	with .Columns.Add("Col-2")
		.DisplayFilterButton = .T.
		.FilterList = 9504 && FilterListEnum.exShowExclude Or FilterListEnum.exShowFocusItem Or FilterListEnum.exShowCheckBox Or FilterListEnum.exSortItemsAsc
	endwith
	with .Columns.Add("Check")
		.Def(0) = .T.
		.DisplayFilterButton = .T.
		.DisplayFilterPattern = .F.
		.FilterType = 6
	endwith
	with .Columns.Add("Image")
		.DisplayFilterButton = .T.
		.FilterType = 10
		.FilterList = 9472 && FilterListEnum.exShowExclude Or FilterListEnum.exShowFocusItem Or FilterListEnum.exShowCheckBox
	endwith
	with .Columns.Add("Pos")
		.AllowSizing = .F.
		.AllowSort = .F.
		.Width = 32
		.FormatColumn = "1 apos ``"
		.Position = 0
	endwith
	with .Items
		.DefaultItem = .AddItem("Item A")
		.CellCaption(0,1) = "Sub-Item A"
		h = .AddItem("Item B")
		.DefaultItem = h
		.CellCaption(0,1) = "Sub-Item B"
		.DefaultItem = h
		.CellState(0,2) = 1
		.DefaultItem = .AddItem("Item C")
		.CellCaption(0,1) = "Sub-Item C"
	endwith
	.FilterBarFont = .Font
	.Object.Description(11) = .FormatABC("`<fgcolor=808080> ` + value + ` </fgcolor>`",.Description(11))
	var_s1 = "(( ( allui replace `[<b>` with `<bgcolor=000000><fgcolor=FFFFFF><b> ` replace `</b>]` with ` </b></bgcolor></fgcolor>` replace `"
	var_s1 = var_s1 + "[<s>` with `<bgcolor=C0C0C0><fgcolor=FFFFFF> ` replace `</s>]` with ` </fgcolor></bgcolor>` )  + `<r><fgcolor=808080>` + ( match"
	var_s1 = var_s1 + "itemcount < 0 ? ( ( len(value) ? `` : `` ) + `<r>` + abs(matchitemcount + 1) + ` result(s)` ) : (`<r><fgcolor=808080>`+ itemcoun"
	var_s1 = var_s1 + "t + ` item(s)`) )))"
	.FilterBarCaption = var_s1
	.FilterBarPromptVisible = 3 && FilterBarVisibleEnum.exFilterBarVisible Or FilterBarVisibleEnum.exFilterBarPromptVisible
	with .Columns.Item(0)
		.FilterType = 240
		.Filter = "Item A|Item B"
	endwith
	.Columns.Item(2).Filter = 1
	.ApplyFilter
	.EndUpdate
endwith
|
|
931
|
FilterBarCaption ALLUI Keyword ( sample 1 )
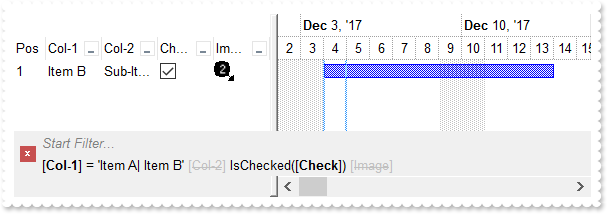
*** AddItem event - Occurs after a new Item has been inserted to Items collection. ***
LPARAMETERS Item
	with thisform.Gantt1
		i = .FormatABC("value + 1",.Items.ItemToIndex(Item))
		.DefaultItem = Item
		.Items.CellImage(0,3) = i
		.Items.AddBar(Item,"Task",{^2017-12-4},{^2017-12-14})
	endwith

with thisform.Gantt1
	.BeginUpdate
	with .Chart
		.LevelCount = 2
		.FirstVisibleDate = {^2017-12-2}
		.PaneWidth(0) = 256
	endwith
	var_s = "gBJJgBAIDAAGAAEAAQhYAf8Pf4hh0QihCJo2AEZjQAjEZFEaIEaEEaAIAkcbk0olUrlktl0vmExmUzmk1m03nE5nU7nk9n0/oFBoVDolFo1HpFJpVLplNp1PqFRqVTql"
	var_s = var_s + "Vq1XrFZrVbrldr1fsFhsVjslls1ntFptVrtltt1vuFxuVzul1u13vF5vV7vl9v1/wGBwWDwmFw2HxGJxWLxmNx0xiFdyOTh8Tf9ZymXx+QytcyNgz8r0OblWjyWds+m0"
	var_s = var_s + "ka1Vf1ta1+r1mos2xrG2xeZ0+a0W0qOx3GO4NV3WeyvD2XJ5XL5nN51aiw+lfSj0gkUkAEllHanHI5j/cHg8EZf7w8vl8j4f/qfEZeB09/vjLAB30+kZQAP/P5/H6/yN"
	var_s = var_s + "AOAEAwCjMBwFAEDwJBMDwLBYAP2/8Hv8/gAGAD8LQs9w/nhDY/oygIA="
	.Images(var_s)
	with .Columns.Add("Col-1")
		.DisplayFilterButton = .T.
		.FilterList = 9504 && FilterListEnum.exShowExclude Or FilterListEnum.exShowFocusItem Or FilterListEnum.exShowCheckBox Or FilterListEnum.exSortItemsAsc
	endwith
	with .Columns.Add("Col-2")
		.DisplayFilterButton = .T.
		.FilterList = 9504 && FilterListEnum.exShowExclude Or FilterListEnum.exShowFocusItem Or FilterListEnum.exShowCheckBox Or FilterListEnum.exSortItemsAsc
	endwith
	with .Columns.Add("Check")
		.Def(0) = .T.
		.DisplayFilterButton = .T.
		.DisplayFilterPattern = .F.
		.FilterType = 6
	endwith
	with .Columns.Add("Image")
		.DisplayFilterButton = .T.
		.FilterType = 10
		.FilterList = 9472 && FilterListEnum.exShowExclude Or FilterListEnum.exShowFocusItem Or FilterListEnum.exShowCheckBox
	endwith
	with .Columns.Add("Pos")
		.AllowSizing = .F.
		.AllowSort = .F.
		.Width = 32
		.FormatColumn = "1 apos ``"
		.Position = 0
	endwith
	with .Items
		.DefaultItem = .AddItem("Item A")
		.CellCaption(0,1) = "Sub-Item A"
		h = .AddItem("Item B")
		.DefaultItem = h
		.CellCaption(0,1) = "Sub-Item B"
		.DefaultItem = h
		.CellState(0,2) = 1
		.DefaultItem = .AddItem("Item C")
		.CellCaption(0,1) = "Sub-Item C"
	endwith
	.FilterBarFont = .Font
	.Object.Description(11) = .FormatABC("`<fgcolor=808080> ` + value + ` </fgcolor>`",.Description(11))
	.FilterBarCaption = "allui"
	.FilterBarPromptVisible = 3 && FilterBarVisibleEnum.exFilterBarVisible Or FilterBarVisibleEnum.exFilterBarPromptVisible
	with .Columns.Item(0)
		.FilterType = 240
		.Filter = "Item A|Item B"
	endwith
	.Columns.Item(2).Filter = 1
	.ApplyFilter
	.EndUpdate
endwith
|
|
930
|
FilterBarCaption AVAILABLE Keyword ( sample 2, result )
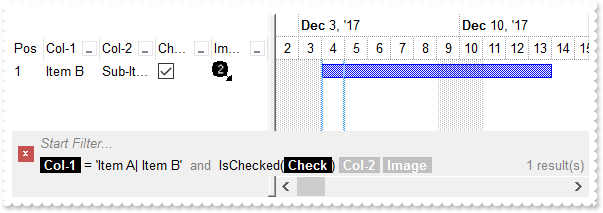
*** AddItem event - Occurs after a new Item has been inserted to Items collection. ***
LPARAMETERS Item
	with thisform.Gantt1
		i = .FormatABC("value + 1",.Items.ItemToIndex(Item))
		.DefaultItem = Item
		.Items.CellImage(0,3) = i
		.Items.AddBar(Item,"Task",{^2017-12-4},{^2017-12-14})
	endwith

with thisform.Gantt1
	.BeginUpdate
	with .Chart
		.LevelCount = 2
		.FirstVisibleDate = {^2017-12-2}
		.PaneWidth(0) = 256
	endwith
	var_s = "gBJJgBAIDAAGAAEAAQhYAf8Pf4hh0QihCJo2AEZjQAjEZFEaIEaEEaAIAkcbk0olUrlktl0vmExmUzmk1m03nE5nU7nk9n0/oFBoVDolFo1HpFJpVLplNp1PqFRqVTql"
	var_s = var_s + "Vq1XrFZrVbrldr1fsFhsVjslls1ntFptVrtltt1vuFxuVzul1u13vF5vV7vl9v1/wGBwWDwmFw2HxGJxWLxmNx0xiFdyOTh8Tf9ZymXx+QytcyNgz8r0OblWjyWds+m0"
	var_s = var_s + "ka1Vf1ta1+r1mos2xrG2xeZ0+a0W0qOx3GO4NV3WeyvD2XJ5XL5nN51aiw+lfSj0gkUkAEllHanHI5j/cHg8EZf7w8vl8j4f/qfEZeB09/vjLAB30+kZQAP/P5/H6/yN"
	var_s = var_s + "AOAEAwCjMBwFAEDwJBMDwLBYAP2/8Hv8/gAGAD8LQs9w/nhDY/oygIA="
	.Images(var_s)
	with .Columns.Add("Col-1")
		.DisplayFilterButton = .T.
		.FilterList = 9504 && FilterListEnum.exShowExclude Or FilterListEnum.exShowFocusItem Or FilterListEnum.exShowCheckBox Or FilterListEnum.exSortItemsAsc
	endwith
	with .Columns.Add("Col-2")
		.DisplayFilterButton = .T.
		.FilterList = 9504 && FilterListEnum.exShowExclude Or FilterListEnum.exShowFocusItem Or FilterListEnum.exShowCheckBox Or FilterListEnum.exSortItemsAsc
	endwith
	with .Columns.Add("Check")
		.Def(0) = .T.
		.DisplayFilterButton = .T.
		.DisplayFilterPattern = .F.
		.FilterType = 6
	endwith
	with .Columns.Add("Image")
		.DisplayFilterButton = .T.
		.FilterType = 10
		.FilterList = 9472 && FilterListEnum.exShowExclude Or FilterListEnum.exShowFocusItem Or FilterListEnum.exShowCheckBox
	endwith
	with .Columns.Add("Pos")
		.AllowSizing = .F.
		.AllowSort = .F.
		.Width = 32
		.FormatColumn = "1 apos ``"
		.Position = 0
	endwith
	with .Items
		.DefaultItem = .AddItem("Item A")
		.CellCaption(0,1) = "Sub-Item A"
		h = .AddItem("Item B")
		.DefaultItem = h
		.CellCaption(0,1) = "Sub-Item B"
		.DefaultItem = h
		.CellState(0,2) = 1
		.DefaultItem = .AddItem("Item C")
		.CellCaption(0,1) = "Sub-Item C"
	endwith
	.FilterBarFont = .Font
	.Object.Description(11) = .FormatABC("`<fgcolor=808080> ` + value + ` </fgcolor>`",.Description(11))
	var_s1 = "(( ( value replace `[` with `<bgcolor=000000><fgcolor=FFFFFF><b> ` replace `]` with ` </b></bgcolor></fgcolor>` ) + ` ` + ( avai"
	var_s1 = var_s1 + "lable replace `[` with `<bgcolor=C0C0C0><fgcolor=FFFFFF><b> ` replace `]` with ` </b></bgcolor></fgcolor>` replace `<s>` with ``"
	var_s1 = var_s1 + " replace `</s>` with `` ) + `<fgcolor=808080>` + ( matchitemcount < 0 ? ( ( len(value) ? `` : `` ) + `<r>` + abs(matchitemcount "
	var_s1 = var_s1 + "+ 1) + ` result(s)` ) : (`<r><fgcolor=808080>`+ itemcount + ` item(s)`) )))"
	.FilterBarCaption = var_s1
	.FilterBarPromptVisible = 3 && FilterBarVisibleEnum.exFilterBarVisible Or FilterBarVisibleEnum.exFilterBarPromptVisible
	with .Columns.Item(0)
		.FilterType = 240
		.Filter = "Item A|Item B"
	endwith
	.Columns.Item(2).Filter = 1
	.ApplyFilter
	.EndUpdate
endwith
|
|
929
|
FilterBarCaption AVAILABLE Keyword ( sample 1 )
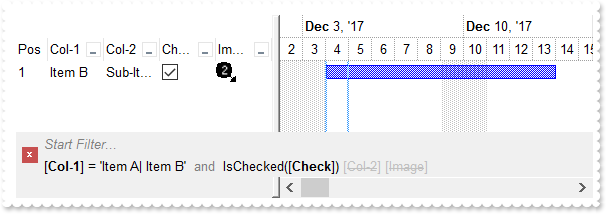
*** AddItem event - Occurs after a new Item has been inserted to Items collection. ***
LPARAMETERS Item
	with thisform.Gantt1
		i = .FormatABC("value + 1",.Items.ItemToIndex(Item))
		.DefaultItem = Item
		.Items.CellImage(0,3) = i
		.Items.AddBar(Item,"Task",{^2017-12-4},{^2017-12-14})
	endwith

with thisform.Gantt1
	.BeginUpdate
	with .Chart
		.LevelCount = 2
		.FirstVisibleDate = {^2017-12-2}
		.PaneWidth(0) = 256
	endwith
	var_s = "gBJJgBAIDAAGAAEAAQhYAf8Pf4hh0QihCJo2AEZjQAjEZFEaIEaEEaAIAkcbk0olUrlktl0vmExmUzmk1m03nE5nU7nk9n0/oFBoVDolFo1HpFJpVLplNp1PqFRqVTql"
	var_s = var_s + "Vq1XrFZrVbrldr1fsFhsVjslls1ntFptVrtltt1vuFxuVzul1u13vF5vV7vl9v1/wGBwWDwmFw2HxGJxWLxmNx0xiFdyOTh8Tf9ZymXx+QytcyNgz8r0OblWjyWds+m0"
	var_s = var_s + "ka1Vf1ta1+r1mos2xrG2xeZ0+a0W0qOx3GO4NV3WeyvD2XJ5XL5nN51aiw+lfSj0gkUkAEllHanHI5j/cHg8EZf7w8vl8j4f/qfEZeB09/vjLAB30+kZQAP/P5/H6/yN"
	var_s = var_s + "AOAEAwCjMBwFAEDwJBMDwLBYAP2/8Hv8/gAGAD8LQs9w/nhDY/oygIA="
	.Images(var_s)
	with .Columns.Add("Col-1")
		.DisplayFilterButton = .T.
		.FilterList = 9504 && FilterListEnum.exShowExclude Or FilterListEnum.exShowFocusItem Or FilterListEnum.exShowCheckBox Or FilterListEnum.exSortItemsAsc
	endwith
	with .Columns.Add("Col-2")
		.DisplayFilterButton = .T.
		.FilterList = 9504 && FilterListEnum.exShowExclude Or FilterListEnum.exShowFocusItem Or FilterListEnum.exShowCheckBox Or FilterListEnum.exSortItemsAsc
	endwith
	with .Columns.Add("Check")
		.Def(0) = .T.
		.DisplayFilterButton = .T.
		.DisplayFilterPattern = .F.
		.FilterType = 6
	endwith
	with .Columns.Add("Image")
		.DisplayFilterButton = .T.
		.FilterType = 10
		.FilterList = 9472 && FilterListEnum.exShowExclude Or FilterListEnum.exShowFocusItem Or FilterListEnum.exShowCheckBox
	endwith
	with .Columns.Add("Pos")
		.AllowSizing = .F.
		.AllowSort = .F.
		.Width = 32
		.FormatColumn = "1 apos ``"
		.Position = 0
	endwith
	with .Items
		.DefaultItem = .AddItem("Item A")
		.CellCaption(0,1) = "Sub-Item A"
		h = .AddItem("Item B")
		.DefaultItem = h
		.CellCaption(0,1) = "Sub-Item B"
		.DefaultItem = h
		.CellState(0,2) = 1
		.DefaultItem = .AddItem("Item C")
		.CellCaption(0,1) = "Sub-Item C"
	endwith
	.FilterBarFont = .Font
	.Object.Description(11) = .FormatABC("`<fgcolor=808080> ` + value + ` </fgcolor>`",.Description(11))
	.FilterBarCaption = "value + ` ` + available"
	.FilterBarPromptVisible = 3 && FilterBarVisibleEnum.exFilterBarVisible Or FilterBarVisibleEnum.exFilterBarPromptVisible
	with .Columns.Item(0)
		.FilterType = 240
		.Filter = "Item A|Item B"
	endwith
	.Columns.Item(2).Filter = 1
	.ApplyFilter
	.EndUpdate
endwith
|
|
928
|
Is it possible to somehow highlight the column's name different than its filter value in the control's filter bar ( sample 3, results )
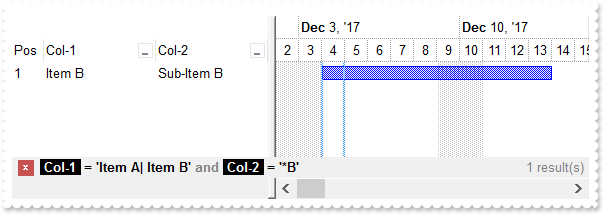
*** AddItem event - Occurs after a new Item has been inserted to Items collection. ***
LPARAMETERS Item
	with thisform.Gantt1
		.Items.AddBar(Item,"Task",{^2017-12-4},{^2017-12-14})
	endwith

with thisform.Gantt1
	.BeginUpdate
	with .Chart
		.LevelCount = 2
		.FirstVisibleDate = {^2017-12-2}
		.PaneWidth(0) = 256
	endwith
	with .Columns.Add("Col-1")
		.DisplayFilterButton = .T.
		.FilterList = 9504 && FilterListEnum.exShowExclude Or FilterListEnum.exShowFocusItem Or FilterListEnum.exShowCheckBox Or FilterListEnum.exSortItemsAsc
	endwith
	with .Columns.Add("Col-2")
		.DisplayFilterButton = .T.
		.FilterList = 9504 && FilterListEnum.exShowExclude Or FilterListEnum.exShowFocusItem Or FilterListEnum.exShowCheckBox Or FilterListEnum.exSortItemsAsc
	endwith
	with .Columns.Add("Pos")
		.AllowSizing = .F.
		.AllowSort = .F.
		.Width = 32
		.FormatColumn = "1 apos ``"
		.Position = 0
	endwith
	with .Items
		.DefaultItem = .AddItem("Item A")
		.CellCaption(0,1) = "Sub-Item A"
		.DefaultItem = .AddItem("Item B")
		.CellCaption(0,1) = "Sub-Item B"
		.DefaultItem = .AddItem("Item C")
		.CellCaption(0,1) = "Sub-Item C"
	endwith
	.FilterBarFont = .Font
	.Object.Description(11) = .FormatABC("`<fgcolor=808080>` + value + `</fgcolor>`",.Description(11))
	var_s = "(`<b>` + value + `</b><fgcolor=808080>` + ( matchitemcount < 0 ? ( ( len(value) ? `` : `` ) + `<r>` + abs(matchitemcount + 1) + "
	var_s = var_s + "` result(s)` ) : (`<fgcolor=808080>`+ itemcount + ` item(s)`) )) replace `[` with `<bgcolor=000000><fgcolor=FFFFFF><b> ` replace"
	var_s = var_s + " `]` with ` </b></bgcolor></fgcolor>`"
	.FilterBarCaption = var_s
	.FilterBarPromptVisible = 256
	with .Columns.Item(0)
		.FilterType = 240
		.Filter = "Item A|Item B"
	endwith
	with .Columns.Item(1)
		.FilterType = 3
		.Filter = "*B"
	endwith
	.ApplyFilter
	.EndUpdate
endwith
|
|
927
|
Is it possible to somehow highlight the column's name different than its filter value in the control's filter bar ( sample 2 )
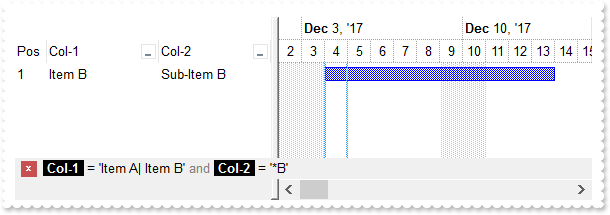
*** AddItem event - Occurs after a new Item has been inserted to Items collection. ***
LPARAMETERS Item
	with thisform.Gantt1
		.Items.AddBar(Item,"Task",{^2017-12-4},{^2017-12-14})
	endwith

with thisform.Gantt1
	.BeginUpdate
	with .Chart
		.LevelCount = 2
		.FirstVisibleDate = {^2017-12-2}
		.PaneWidth(0) = 256
	endwith
	with .Columns.Add("Col-1")
		.DisplayFilterButton = .T.
		.FilterList = 9504 && FilterListEnum.exShowExclude Or FilterListEnum.exShowFocusItem Or FilterListEnum.exShowCheckBox Or FilterListEnum.exSortItemsAsc
	endwith
	with .Columns.Add("Col-2")
		.DisplayFilterButton = .T.
		.FilterList = 9504 && FilterListEnum.exShowExclude Or FilterListEnum.exShowFocusItem Or FilterListEnum.exShowCheckBox Or FilterListEnum.exSortItemsAsc
	endwith
	with .Columns.Add("Pos")
		.AllowSizing = .F.
		.AllowSort = .F.
		.Width = 32
		.FormatColumn = "1 apos ``"
		.Position = 0
	endwith
	with .Items
		.DefaultItem = .AddItem("Item A")
		.CellCaption(0,1) = "Sub-Item A"
		.DefaultItem = .AddItem("Item B")
		.CellCaption(0,1) = "Sub-Item B"
		.DefaultItem = .AddItem("Item C")
		.CellCaption(0,1) = "Sub-Item C"
	endwith
	.FilterBarFont = .Font
	.Object.Description(11) = .FormatABC("`<fgcolor=808080>` + value + `</fgcolor>`",.Description(11))
	.FilterBarCaption = "value replace `[` with `<bgcolor=000000><fgcolor=FFFFFF><b> ` replace `]` with ` </b></bgcolor></fgcolor>`"
	.FilterBarPromptVisible = 256
	with .Columns.Item(0)
		.FilterType = 240
		.Filter = "Item A|Item B"
	endwith
	with .Columns.Item(1)
		.FilterType = 3
		.Filter = "*B"
	endwith
	.ApplyFilter
	.EndUpdate
endwith
|
|
926
|
Is it possible to somehow highlight the column's name different than its filter value in the control's filter bar ( sample 1 )
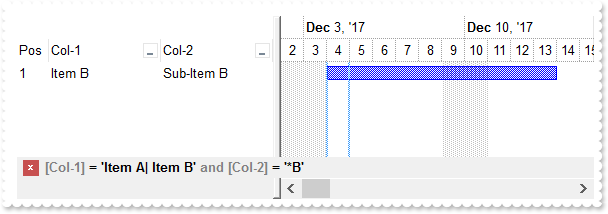
*** AddItem event - Occurs after a new Item has been inserted to Items collection. ***
LPARAMETERS Item
	with thisform.Gantt1
		.Items.AddBar(Item,"Task",{^2017-12-4},{^2017-12-14})
	endwith

with thisform.Gantt1
	.BeginUpdate
	with .Chart
		.LevelCount = 2
		.FirstVisibleDate = {^2017-12-2}
		.PaneWidth(0) = 256
	endwith
	with .Columns.Add("Col-1")
		.DisplayFilterButton = .T.
		.FilterList = 9504 && FilterListEnum.exShowExclude Or FilterListEnum.exShowFocusItem Or FilterListEnum.exShowCheckBox Or FilterListEnum.exSortItemsAsc
	endwith
	with .Columns.Add("Col-2")
		.DisplayFilterButton = .T.
		.FilterList = 9504 && FilterListEnum.exShowExclude Or FilterListEnum.exShowFocusItem Or FilterListEnum.exShowCheckBox Or FilterListEnum.exSortItemsAsc
	endwith
	with .Columns.Add("Pos")
		.AllowSizing = .F.
		.AllowSort = .F.
		.Width = 32
		.FormatColumn = "1 apos ``"
		.Position = 0
	endwith
	with .Items
		.DefaultItem = .AddItem("Item A")
		.CellCaption(0,1) = "Sub-Item A"
		.DefaultItem = .AddItem("Item B")
		.CellCaption(0,1) = "Sub-Item B"
		.DefaultItem = .AddItem("Item C")
		.CellCaption(0,1) = "Sub-Item C"
	endwith
	.Object.Description(11) = .FormatABC("`<fgcolor=808080>` + value + `</fgcolor>`",.Description(11))
	.FilterBarCaption = "value replace `[` with `<fgcolor=808080>[` replace `]` with `]</fgcolor>`"
	.FilterBarPromptVisible = 256
	with .Columns.Item(0)
		.FilterType = 240
		.Filter = "Item A|Item B"
	endwith
	with .Columns.Item(1)
		.FilterType = 3
		.Filter = "*B"
	endwith
	.ApplyFilter
	.EndUpdate
endwith
|
|
925
|
Is it possible to automatically displays the control's filter label to the right
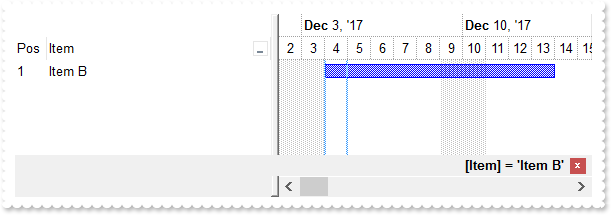
*** AddItem event - Occurs after a new Item has been inserted to Items collection. ***
LPARAMETERS Item
	with thisform.Gantt1
		.Items.AddBar(Item,"Task",{^2017-12-4},{^2017-12-14})
	endwith

with thisform.Gantt1
	.BeginUpdate
	with .Chart
		.LevelCount = 2
		.FirstVisibleDate = {^2017-12-2}
		.PaneWidth(0) = 256
	endwith
	with .Columns.Add("Item")
		.DisplayFilterButton = .T.
		.FilterList = 9504 && FilterListEnum.exShowExclude Or FilterListEnum.exShowFocusItem Or FilterListEnum.exShowCheckBox Or FilterListEnum.exSortItemsAsc
	endwith
	with .Columns.Add("Pos")
		.AllowSizing = .F.
		.AllowSort = .F.
		.Width = 32
		.FormatColumn = "1 apos ``"
		.Position = 0
	endwith
	with .Items
		.AddItem("Item A")
		.AddItem("Item B")
		.AddItem("Item C")
	endwith
	.FilterBarCaption = "`<r>` + value"
	.FilterBarPromptVisible = 1280 && FilterBarVisibleEnum.exFilterBarShowCloseOnRight Or FilterBarVisibleEnum.exFilterBarToggle
	with .Columns.Item(0)
		.FilterType = 240
		.Filter = "Item B"
	endwith
	.ApplyFilter
	.EndUpdate
endwith
|
|
924
|
How can I get the number of results/items being shown in the control's filter bar (sample 4)
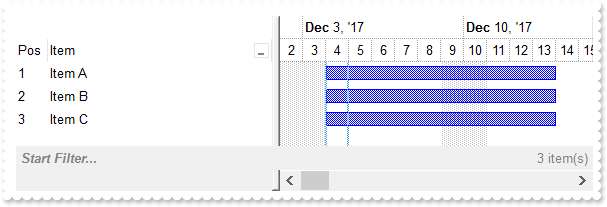
*** AddItem event - Occurs after a new Item has been inserted to Items collection. ***
LPARAMETERS Item
	with thisform.Gantt1
		.Items.AddBar(Item,"Task",{^2017-12-4},{^2017-12-14})
	endwith

with thisform.Gantt1
	.BeginUpdate
	with .Chart
		.LevelCount = 2
		.FirstVisibleDate = {^2017-12-2}
		.PaneWidth(0) = 256
	endwith
	with .Columns.Add("Item")
		.DisplayFilterButton = .T.
		.FilterList = 9504 && FilterListEnum.exShowExclude Or FilterListEnum.exShowFocusItem Or FilterListEnum.exShowCheckBox Or FilterListEnum.exSortItemsAsc
	endwith
	with .Columns.Add("Pos")
		.AllowSizing = .F.
		.AllowSort = .F.
		.Width = 32
		.FormatColumn = "1 apos ``"
		.Position = 0
	endwith
	with .Items
		.AddItem("Item A")
		.AddItem("Item B")
		.AddItem("Item C")
	endwith
	.FilterBarFont = .Font
	.FilterBarPrompt = .FormatABC("`<b>` + value",.FilterBarPrompt)
	var_s = "`<b><r>` + value + `</b><fgcolor=808080>` + ( matchitemcount < 0 ? ( ( len(value) ? `<br>` : `` ) + `<r>` + abs(matchitemcount +"
	var_s = var_s + " 1) + ` result(s)` ) : (`<fgcolor=808080>`+ itemcount + ` item(s)`) )"
	.FilterBarCaption = var_s
	.FilterBarPromptVisible = 3591 && FilterBarVisibleEnum.exFilterBarCompact Or FilterBarVisibleEnum.exFilterBarShowCloseOnRight Or FilterBarVisibleEnum.exFilterBarShowCloseIfRequired Or FilterBarVisibleEnum.exFilterBarCaptionVisible Or FilterBarVisibleEnum.exFilterBarVisible Or FilterBarVisibleEnum.exFilterBarPromptVisible
	.EndUpdate
endwith
|
|
923
|
How can I get the number of results being shown in the control's filter bar (sample 3)
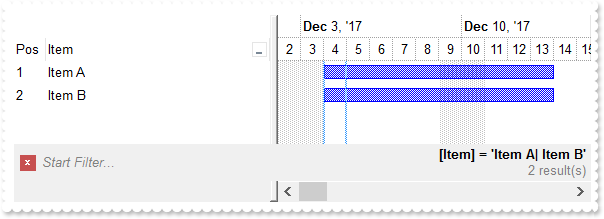
*** AddItem event - Occurs after a new Item has been inserted to Items collection. ***
LPARAMETERS Item
	with thisform.Gantt1
		.Items.AddBar(Item,"Task",{^2017-12-4},{^2017-12-14})
	endwith

with thisform.Gantt1
	.BeginUpdate
	with .Chart
		.LevelCount = 2
		.FirstVisibleDate = {^2017-12-2}
		.PaneWidth(0) = 256
	endwith
	.Columns.Add("Item").DisplayFilterButton = .T.
	with .Columns.Add("Pos")
		.AllowSizing = .F.
		.AllowSort = .F.
		.Width = 32
		.FormatColumn = "1 apos ``"
		.Position = 0
	endwith
	with .Items
		.AddItem("Item A")
		.AddItem("Item B")
		.AddItem("Item C")
	endwith
	.FilterBarFont = .Font
	var_s = "`<b><r>` + value + `</b><fgcolor=808080>` + ( matchitemcount < 0 ? ( ( len(value) ? `<br>` : `` ) + `<r>` + abs(matchitemcount +"
	var_s = var_s + " 1) + ` result(s)` ) : ``)"
	.FilterBarCaption = var_s
	.FilterBarPromptVisible = 2055 && FilterBarVisibleEnum.exFilterBarCompact Or FilterBarVisibleEnum.exFilterBarCaptionVisible Or FilterBarVisibleEnum.exFilterBarVisible Or FilterBarVisibleEnum.exFilterBarPromptVisible
	with .Columns.Item(0)
		.FilterType = 240
		.Filter = "Item A|Item B"
	endwith
	.ApplyFilter
	.EndUpdate
endwith
|
|
922
|
How can I get the number of results being shown in the control's filter bar (sample 2, compact)
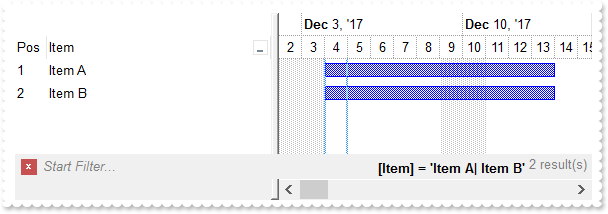
*** AddItem event - Occurs after a new Item has been inserted to Items collection. ***
LPARAMETERS Item
	with thisform.Gantt1
		.Items.AddBar(Item,"Task",{^2017-12-4},{^2017-12-14})
	endwith

with thisform.Gantt1
	.BeginUpdate
	with .Chart
		.LevelCount = 2
		.FirstVisibleDate = {^2017-12-2}
		.PaneWidth(0) = 256
	endwith
	.Columns.Add("Item").DisplayFilterButton = .T.
	with .Columns.Add("Pos")
		.AllowSizing = .F.
		.AllowSort = .F.
		.Width = 32
		.FormatColumn = "1 apos ``"
		.Position = 0
	endwith
	with .Items
		.AddItem("Item A")
		.AddItem("Item B")
		.AddItem("Item C")
	endwith
	.FilterBarFont = .Font
	.FilterBarCaption = "`<b><r>` + value + `</b><fgcolor=808080>` + ( matchitemcount < 0 ? `<off -4> ` + abs(matchitemcount + 1) + ` result(s)` : ``)"
	.FilterBarPromptVisible = 2071 && FilterBarVisibleEnum.exFilterBarCompact Or FilterBarVisibleEnum.exFilterBarSingleLine Or FilterBarVisibleEnum.exFilterBarCaptionVisible Or FilterBarVisibleEnum.exFilterBarVisible Or FilterBarVisibleEnum.exFilterBarPromptVisible
	with .Columns.Item(0)
		.FilterType = 240
		.Filter = "Item A|Item B"
	endwith
	.ApplyFilter
	.EndUpdate
endwith
|
|
921
|
How can I get the number of results being shown in the control's filter bar (sample 1)
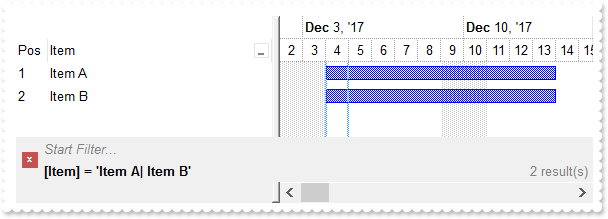
*** AddItem event - Occurs after a new Item has been inserted to Items collection. ***
LPARAMETERS Item
	with thisform.Gantt1
		.Items.AddBar(Item,"Task",{^2017-12-4},{^2017-12-14})
	endwith

with thisform.Gantt1
	.BeginUpdate
	with .Chart
		.LevelCount = 2
		.FirstVisibleDate = {^2017-12-2}
		.PaneWidth(0) = 256
	endwith
	.Columns.Add("Item").DisplayFilterButton = .T.
	with .Columns.Add("Pos")
		.AllowSizing = .F.
		.AllowSort = .F.
		.Width = 32
		.FormatColumn = "1 apos ``"
		.Position = 0
	endwith
	with .Items
		.AddItem("Item A")
		.AddItem("Item B")
		.AddItem("Item C")
	endwith
	.FilterBarFont = .Font
	.FilterBarCaption = "`<b>` + value + `</b><r><fgcolor=808080>` + ( matchitemcount < 0 ? abs(matchitemcount + 1) + ` result(s)` : ``)"
	.FilterBarPromptVisible = 7 && FilterBarVisibleEnum.exFilterBarCaptionVisible Or FilterBarVisibleEnum.exFilterBarVisible Or FilterBarVisibleEnum.exFilterBarPromptVisible
	with .Columns.Item(0)
		.FilterType = 240
		.Filter = "Item A|Item B"
	endwith
	.ApplyFilter
	.EndUpdate
endwith
|
|
920
|
FilterBarCaption Predefined Keywords
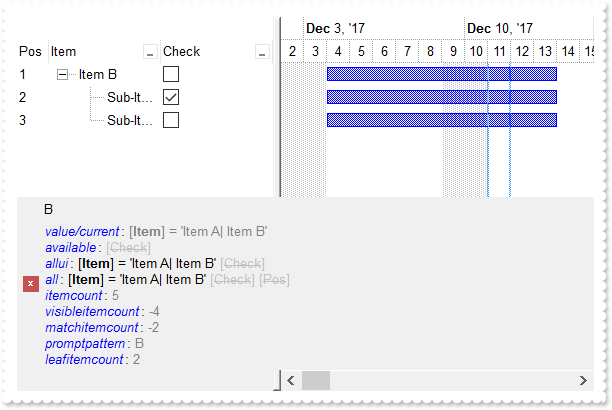
*** AddItem event - Occurs after a new Item has been inserted to Items collection. ***
LPARAMETERS Item
	with thisform.Gantt1
		.Items.AddBar(Item,"Task",{^2017-12-4},{^2017-12-14})
	endwith

*** AfterExpandItem event - Fired after an item is expanded (collapsed). ***
LPARAMETERS Item
	with thisform.Gantt1
		.Refresh
	endwith

with thisform.Gantt1
	.BeginUpdate
	with .Chart
		.LevelCount = 2
		.FirstVisibleDate = {^2017-12-2}
		.PaneWidth(0) = 256
	endwith
	.LinesAtRoot = -1
	.Columns.Add("Item").DisplayFilterButton = .T.
	with .Columns.Add("Check")
		.Def(0) = .T.
		.DisplayFilterButton = .T.
		.DisplayFilterPattern = .F.
		.FilterType = 6
	endwith
	with .Columns.Add("Pos")
		.AllowSizing = .F.
		.AllowSort = .F.
		.Width = 32
		.FormatColumn = "1 apos ``"
		.Position = 0
	endwith
	with .Items
		.AddItem("Item A")
		h = .AddItem("Item B")
		.DefaultItem = .InsertItem(h,Null,"Sub-Item B1")
		.CellState(0,1) = 1
		.InsertItem(h,Null,"Sub-Item B2")
		.DefaultItem = h
		.ExpandItem(0) = .T.
		.AddItem("Item C")
	endwith
	.FilterInclude = 1
	.FilterBarFont = .Font
	var_s = "`<fgcolor=0000FF><i>value/current</i></fgcolor>: <fgcolor=808080>` + value + `</fgcolor>` + `<br><fgcolor=0000FF><i>available</i"
	var_s = var_s + "></fgcolor>: ` + available + `<br><fgcolor=0000FF><i>allui</i></fgcolor>: ` + allui + `<br><fgcolor=0000FF><i>all</i></fgcolor>:"
	var_s = var_s + " ` + all + `<br><fgcolor=0000FF><i>itemcount</i></fgcolor>: <fgcolor=808080>` + itemcount + `</fgcolor>`+ `<br><fgcolor=0000FF><"
	var_s = var_s + "i>visibleitemcount</i></fgcolor>: <fgcolor=808080>` + visibleitemcount + `</fgcolor>`+ `<br><fgcolor=0000FF><i>matchitemcount</i"
	var_s = var_s + "></fgcolor>: <fgcolor=808080>` + matchitemcount + `</fgcolor>`+ `<br><fgcolor=0000FF><i>promptpattern</i></fgcolor>: <fgcolor=80"
	var_s = var_s + "8080>` + promptpattern + `</fgcolor>`+ `<br><fgcolor=0000FF><i>leafitemcount</i></fgcolor>: <fgcolor=808080>` + leafitemcount + "
	var_s = var_s + "`</fgcolor>`"
	.FilterBarCaption = var_s
	.FilterBarPromptPattern = "B"
	.FilterBarPromptVisible = 7 && FilterBarVisibleEnum.exFilterBarCaptionVisible Or FilterBarVisibleEnum.exFilterBarVisible Or FilterBarVisibleEnum.exFilterBarPromptVisible
	with .Columns.Item(0)
		.FilterType = 240
		.Filter = "Item A|Item B"
	endwith
	.ApplyFilter
	.EndUpdate
endwith
|
|
919
|
I am using filter prompt feature, and also column's filter, just wondering if possible to compact displaying the filter bar so it won't show on multiple lines
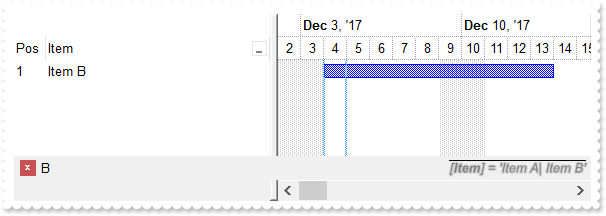
*** AddItem event - Occurs after a new Item has been inserted to Items collection. ***
LPARAMETERS Item
	with thisform.Gantt1
		.Items.AddBar(Item,"Task",{^2017-12-4},{^2017-12-14})
	endwith

with thisform.Gantt1
	.BeginUpdate
	with .Chart
		.LevelCount = 2
		.FirstVisibleDate = {^2017-12-2}
		.PaneWidth(0) = 256
	endwith
	.Columns.Add("Item").DisplayFilterButton = .T.
	with .Columns.Add("Pos")
		.AllowSizing = .F.
		.AllowSort = .F.
		.Width = 32
		.FormatColumn = "1 apos ``"
		.Position = 0
	endwith
	with .Items
		.AddItem("Item A")
		.AddItem("Item B")
		.AddItem("Item C")
	endwith
	.FilterBarFont = .Font
	.FilterBarCaption = "`<r><i><fgcolor=808080><upline><solidline><sha ;;0>` + value"
	.FilterBarPromptPattern = "B"
	.FilterBarPromptVisible = 2067 && FilterBarVisibleEnum.exFilterBarCompact Or FilterBarVisibleEnum.exFilterBarSingleLine Or FilterBarVisibleEnum.exFilterBarVisible Or FilterBarVisibleEnum.exFilterBarPromptVisible
	with .Columns.Item(0)
		.FilterType = 240
		.Filter = "Item A|Item B"
	endwith
	.ApplyFilter
	.EndUpdate
endwith
|
|
918
|
Just wondering if it is possible to show the filter bar's close button on the right ( sample 2 )
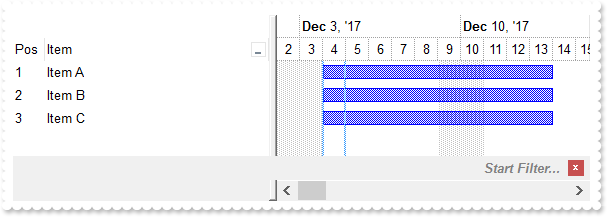
*** AddItem event - Occurs after a new Item has been inserted to Items collection. ***
LPARAMETERS Item
	with thisform.Gantt1
		.Items.AddBar(Item,"Task",{^2017-12-4},{^2017-12-14})
	endwith

with thisform.Gantt1
	.BeginUpdate
	with .Chart
		.LevelCount = 2
		.FirstVisibleDate = {^2017-12-2}
		.PaneWidth(0) = 256
	endwith
	.Columns.Add("Item").DisplayFilterButton = .T.
	with .Columns.Add("Pos")
		.AllowSizing = .F.
		.AllowSort = .F.
		.Width = 32
		.FormatColumn = "1 apos ``"
		.Position = 0
	endwith
	with .Items
		.AddItem("Item A")
		.AddItem("Item B")
		.AddItem("Item C")
	endwith
	.FilterBarPromptVisible = 1281 && FilterBarVisibleEnum.exFilterBarShowCloseOnRight Or FilterBarVisibleEnum.exFilterBarToggle Or FilterBarVisibleEnum.exFilterBarPromptVisible
	.FilterBarPrompt = .FormatABC("`<r>` + value",.FilterBarPrompt)
	.EndUpdate
endwith
|
|
917
|
Just wondering if it is possible to show the filter bar's close button on the right ( sample 1 )
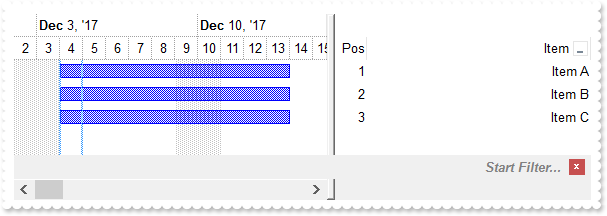
*** AddItem event - Occurs after a new Item has been inserted to Items collection. ***
LPARAMETERS Item
	with thisform.Gantt1
		.Items.AddBar(Item,"Task",{^2017-12-4},{^2017-12-14})
	endwith

with thisform.Gantt1
	.BeginUpdate
	with .Chart
		.LevelCount = 2
		.FirstVisibleDate = {^2017-12-2}
		.PaneWidth(0) = 256
	endwith
	.RightToLeft = .T.
	.Columns.Add("Item").DisplayFilterButton = .T.
	with .Columns.Add("Pos")
		.AllowSizing = .F.
		.AllowSort = .F.
		.Width = 32
		.FormatColumn = "1 apos ``"
		.Position = 0
	endwith
	with .Items
		.AddItem("Item A")
		.AddItem("Item B")
		.AddItem("Item C")
	endwith
	.FilterBarPromptVisible = 257 && FilterBarVisibleEnum.exFilterBarToggle Or FilterBarVisibleEnum.exFilterBarPromptVisible
	.EndUpdate
endwith
|
|
916
|
How can I change the visual appearance of the filter bar's close button (EBN)
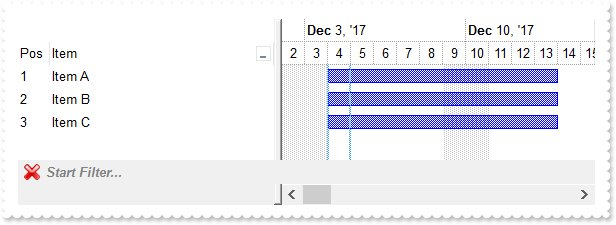
*** AddItem event - Occurs after a new Item has been inserted to Items collection. ***
LPARAMETERS Item
	with thisform.Gantt1
		.Items.AddBar(Item,"Task",{^2017-12-4},{^2017-12-14})
	endwith

with thisform.Gantt1
	.BeginUpdate
	with .Chart
		.LevelCount = 2
		.FirstVisibleDate = {^2017-12-2}
		.PaneWidth(0) = 256
	endwith
	with .VisualAppearance
		var_s = "gBFLBCJwBAEHhEJAAEhABHQDg6AADACAxRDgMQBQKAAzAJBIYhiG4cYCgMZhXDOCYXABCEYRXBIZQ7BKNIxjSJ5BhIAAyDSJMjSRJUEhqGCWYDleYYYAKHIMQLOg7IJj"
		var_s = var_s + "yI4/SJAYCydKAWhxIaZKJHCZoEDaTAADCNVAQp6MEIJVbVEI0e79OgBLp/Z7kECIJJAaRjHQdJxGLA8EhtCQhCZteK6SgMKJYXhWQYRXI1JwvMBrWrdQjiOYELQtMKmS"
		var_s = var_s + "ZNLYGG4dR5SVJbcYhSYsRRFMoyDIOXYDLKsdYqSpXIThObEGgaPqJYjsUjCMKnR7HVIURrBPC9TBPE69ZgmC6ucKPX51ShKFaBWDZcwFAS+UBuYCAILiEAQGZ1XT8ORO"
		var_s = var_s + "icbgJgSTJRlCaZeDsHY7QGR4xkSYp3CaExZAQMgalQYAwjCAAfBANxcA2TgKAUOpDCGFhKg0RpXCwCwDHQHQHEyAIkCkOhbFOGA8A8DohBgRg9AccZcn8EpEjMLI2C2D"
		var_s = var_s + "YxAgQgvAIUIVkoAAPBQDJlECTZ3CCYwDACQwUA8A5MCAWAWDiQi4l8aQOEgLJuBgBgDmYFAzEoIoIl0WALgKYJbBABADAAHgHg8VAMmqCQQDMXABAATYwTmNwBDATJXA"
		var_s = var_s + "iAgjHmNQ5lgQ5QEQEQMmcWg/GwD5ylyNw2gMcJcjsBgBgOQQDDhRpVAMMwnDBFw1B0Ax8D0DxOmmJJIGQTY5hGMAwkwM4CAYLZAmAOJnAqAojiIGg6iieYkmeAYOHaKJ"
		var_s = var_s + "DCyCwjH6AoggsQpQliAJLhgaJ0CESBTnyDwjk+cg4g4P5IHIHJ+BWRRzlYWAxiOUxihsY4KjKLJRGqC44FCegkkkM58iAKAPnIWIWD8SRSFSfQnkmewUhYP4GiGKJ7G0"
		var_s = var_s + "TIbCSUoggqUo0lAQ4LnEcBcD8Coiiif4nE+eAAn2HpOkcFJqi4T5SkyMw/kqQown8IBIBOdA+A+DJrBqVxXEqYo4lCApLhGHBnD8S4ymyfxmg+cwQkQP5egOUZIWoEAk"
		var_s = var_s + "jIeIPBMBJBD+TBjBifwvkuc58hQJQPmFrYykkchclSApKjGOBuD+TRDFCfw3mmIxNi8FxFlOXhVC4aYDFyPgvg2YBcBcLZGCGCJ0DSLRzGSWQ/lmY5+mEP5gmMDBZRSM"
		var_s = var_s + "RsFsOxMhMJJ/DsTpTnwaQaE+N5ojuNhdEYNI5C4TZJO1GRDmCaxnA2Yx4n8IpIjOTBQBQC5TgyYw7gUYRYikC0BYRwsDQBoB8eA6Q2hsE0BUXgywZtYCyHMKwnxSAhAQ"
		var_s = var_s + "HkIQhRrBaDsCwA4ERiB2EWAIYIXhhiVEgAEUYwwYjyASLge4FhHgRDkM8OQih0jWPkGgBBAQ"
		.Add(1,var_s)
	endwith
	.Columns.Add("Item").DisplayFilterButton = .T.
	with .Columns.Add("Pos")
		.AllowSizing = .F.
		.AllowSort = .F.
		.Width = 32
		.FormatColumn = "1 apos ``"
		.Position = 0
	endwith
	with .Items
		.AddItem("Item A")
		.AddItem("Item B")
		.AddItem("Item C")
	endwith
	.FilterBarPromptVisible = 257 && FilterBarVisibleEnum.exFilterBarToggle Or FilterBarVisibleEnum.exFilterBarPromptVisible
	.Object.Background(1) = 0x1000000
	.EndUpdate
endwith
|
|
915
|
How can I change the visual appearance of the filter bar's close button (solid)
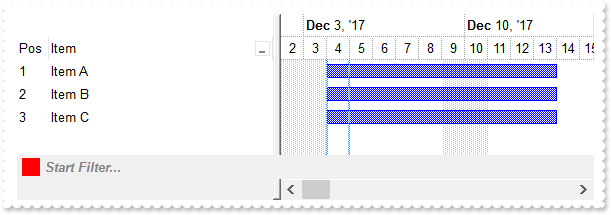
*** AddItem event - Occurs after a new Item has been inserted to Items collection. ***
LPARAMETERS Item
	with thisform.Gantt1
		.Items.AddBar(Item,"Task",{^2017-12-4},{^2017-12-14})
	endwith

with thisform.Gantt1
	.BeginUpdate
	with .Chart
		.LevelCount = 2
		.FirstVisibleDate = {^2017-12-2}
		.PaneWidth(0) = 256
	endwith
	.Columns.Add("Item").DisplayFilterButton = .T.
	with .Columns.Add("Pos")
		.AllowSizing = .F.
		.AllowSort = .F.
		.Width = 32
		.FormatColumn = "1 apos ``"
		.Position = 0
	endwith
	with .Items
		.AddItem("Item A")
		.AddItem("Item B")
		.AddItem("Item C")
	endwith
	.FilterBarPromptVisible = 1
	.Object.Background(1) = RGB(255,0,0)
	.EndUpdate
endwith
|
|
914
|
Is it possible to prevent definitely showing the filter bar's close button
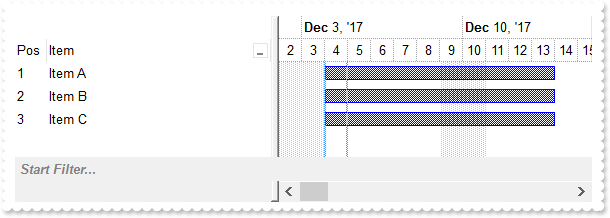
*** AddItem event - Occurs after a new Item has been inserted to Items collection. ***
LPARAMETERS Item
	with thisform.Gantt1
		.Items.AddBar(Item,"Task",{^2017-12-4},{^2017-12-14})
	endwith

with thisform.Gantt1
	.BeginUpdate
	with .Chart
		.LevelCount = 2
		.FirstVisibleDate = {^2017-12-2}
		.PaneWidth(0) = 256
	endwith
	.Columns.Add("Item").DisplayFilterButton = .T.
	with .Columns.Add("Pos")
		.AllowSizing = .F.
		.AllowSort = .F.
		.Width = 32
		.FormatColumn = "1 apos ``"
		.Position = 0
	endwith
	with .Items
		.AddItem("Item A")
		.AddItem("Item B")
		.AddItem("Item C")
	endwith
	.FilterBarPromptVisible = 1
	.Object.Background(1) = -1
	.EndUpdate
endwith
|
|
913
|
Is it possible to show the close button only if there is a filter applied
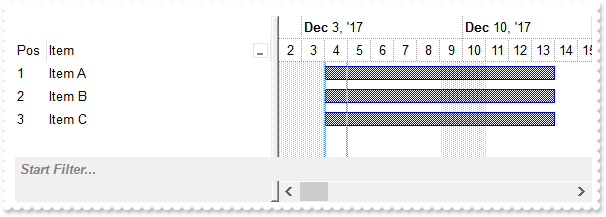
*** AddItem event - Occurs after a new Item has been inserted to Items collection. ***
LPARAMETERS Item
	with thisform.Gantt1
		.Items.AddBar(Item,"Task",{^2017-12-4},{^2017-12-14})
	endwith

with thisform.Gantt1
	.BeginUpdate
	with .Chart
		.LevelCount = 2
		.FirstVisibleDate = {^2017-12-2}
		.PaneWidth(0) = 256
	endwith
	.Columns.Add("Item").DisplayFilterButton = .T.
	with .Columns.Add("Pos")
		.AllowSizing = .F.
		.AllowSort = .F.
		.Width = 32
		.FormatColumn = "1 apos ``"
		.Position = 0
	endwith
	with .Items
		.AddItem("Item A")
		.AddItem("Item B")
		.AddItem("Item C")
	endwith
	.FilterBarPromptVisible = 513 && FilterBarVisibleEnum.exFilterBarShowCloseIfRequired Or FilterBarVisibleEnum.exFilterBarPromptVisible
	.EndUpdate
endwith
|
|
912
|
The control's filter bar is not closed once I click the close button (toggle)
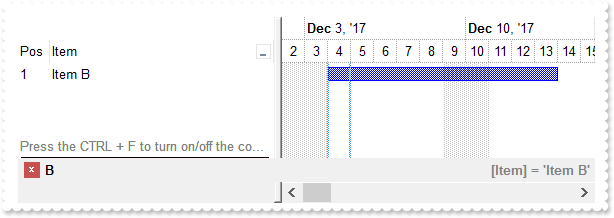
*** AddItem event - Occurs after a new Item has been inserted to Items collection. ***
LPARAMETERS Item
	with thisform.Gantt1
		.Items.AddBar(Item,"Task",{^2017-12-4},{^2017-12-14})
	endwith

with thisform.Gantt1
	.BeginUpdate
	with .Chart
		.LevelCount = 2
		.FirstVisibleDate = {^2017-12-2}
		.PaneWidth(0) = 256
	endwith
	.Columns.Add("Item").DisplayFilterButton = .T.
	with .Columns.Add("Pos")
		.AllowSizing = .F.
		.AllowSort = .F.
		.Width = 32
		.FormatColumn = "1 apos ``"
		.Position = 0
	endwith
	with .Items
		.AddItem("Item A")
		.AddItem("Item B")
		.AddItem("Item C")
		.LockedItemCount(2) = 1
		h = .LockedItem(2,0)
		.DefaultItem = h
		.ItemDivider(0) = 0
		.DefaultItem = h
		.CellCaption(0,0) = "<c><fgcolor=808080>Press the CTRL + F to turn on/off the control's filter bar. ALT + Up/Down moves the focus."
		.DefaultItem = h
		.CellCaptionFormat(0,0) = 1
	endwith
	.FilterBarCaption = "`<r><fgcolor=808080>` + value"
	.FilterBarPromptPattern = "B"
	.FilterBarPromptVisible = 2323 && FilterBarVisibleEnum.exFilterBarCompact Or FilterBarVisibleEnum.exFilterBarToggle Or FilterBarVisibleEnum.exFilterBarSingleLine Or FilterBarVisibleEnum.exFilterBarVisible Or FilterBarVisibleEnum.exFilterBarPromptVisible
	with .Columns.Item(0)
		.FilterType = 240
		.Filter = "Item B"
	endwith
	.ApplyFilter
	.EndUpdate
endwith
|
|
911
|
How can I display the control's filter on a single line
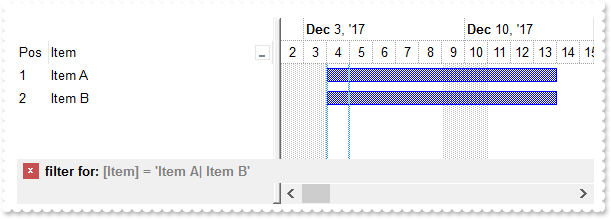
*** AddItem event - Occurs after a new Item has been inserted to Items collection. ***
LPARAMETERS Item
	with thisform.Gantt1
		.Items.AddBar(Item,"Task",{^2017-12-4},{^2017-12-14})
	endwith

with thisform.Gantt1
	.BeginUpdate
	with .Chart
		.LevelCount = 2
		.FirstVisibleDate = {^2017-12-2}
		.PaneWidth(0) = 256
	endwith
	.Columns.Add("Item").DisplayFilterButton = .T.
	with .Columns.Add("Pos")
		.AllowSizing = .F.
		.AllowSort = .F.
		.Width = 32
		.FormatColumn = "1 apos ``"
		.Position = 0
	endwith
	with .Items
		.AddItem("Item A")
		.AddItem("Item B")
		.AddItem("Item C")
	endwith
	.FilterBarCaption = "len(value) ? `filter for: <fgcolor 808080>` + value  : `<fgcolor 808080>no filter`"
	.FilterBarPromptVisible = 18 && FilterBarVisibleEnum.exFilterBarSingleLine Or FilterBarVisibleEnum.exFilterBarVisible
	with .Columns.Item(0)
		.FilterType = 240
		.Filter = "Item A|Item B"
	endwith
	.ApplyFilter
	.EndUpdate
endwith
|
|
910
|
How can I display the control's filter on a single line (prompt-combined)
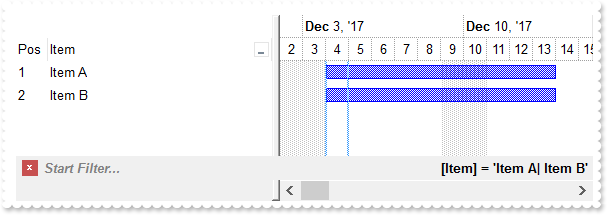
*** AddItem event - Occurs after a new Item has been inserted to Items collection. ***
LPARAMETERS Item
	with thisform.Gantt1
		.Items.AddBar(Item,"Task",{^2017-12-4},{^2017-12-14})
	endwith

with thisform.Gantt1
	.BeginUpdate
	with .Chart
		.LevelCount = 2
		.FirstVisibleDate = {^2017-12-2}
		.PaneWidth(0) = 256
	endwith
	.Columns.Add("Item").DisplayFilterButton = .T.
	with .Columns.Add("Pos")
		.AllowSizing = .F.
		.AllowSort = .F.
		.Width = 32
		.FormatColumn = "1 apos ``"
		.Position = 0
	endwith
	with .Items
		.AddItem("Item A")
		.AddItem("Item B")
		.AddItem("Item C")
	endwith
	.FilterBarCaption = "`<r>` + value"
	.FilterBarPromptVisible = 2067 && FilterBarVisibleEnum.exFilterBarCompact Or FilterBarVisibleEnum.exFilterBarSingleLine Or FilterBarVisibleEnum.exFilterBarVisible Or FilterBarVisibleEnum.exFilterBarPromptVisible
	with .Columns.Item(0)
		.FilterType = 240
		.Filter = "Item A|Item B"
	endwith
	.ApplyFilter
	.EndUpdate
endwith
|
|
909
|
How can I get the number of results after a filter is applied
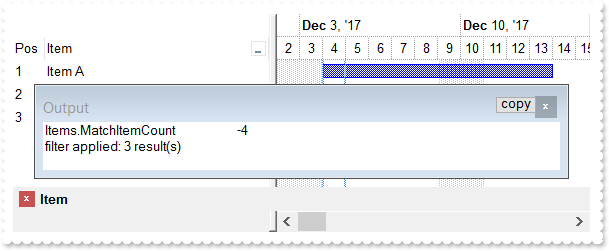
*** AddItem event - Occurs after a new Item has been inserted to Items collection. ***
LPARAMETERS Item
	with thisform.Gantt1
		.Items.AddBar(Item,"Task",{^2017-12-4},{^2017-12-14})
	endwith

*** Click event - Occurs when the user presses and then releases the left mouse button over the tree control. ***
LPARAMETERS nop
	with thisform.Gantt1
		.ClearFilter
	endwith

*** FilterChange event - Occurs when the filter was changed. ***
LPARAMETERS nop
	with thisform.Gantt1
		DEBUGOUT( "Items.MatchItemCount" )
		DEBUGOUT( .Items.MatchItemCount )
		DEBUGOUT( .FormatABC("value < 0 ? `filter applied: ` + abs(value + 1) + ` result(s)` : `no filter`",.Items.MatchItemCount) )
	endwith

with thisform.Gantt1
	.BeginUpdate
	with .Chart
		.LevelCount = 2
		.FirstVisibleDate = {^2017-12-2}
		.PaneWidth(0) = 256
	endwith
	.Columns.Add("Item").DisplayFilterButton = .T.
	with .Columns.Add("Pos")
		.AllowSizing = .F.
		.AllowSort = .F.
		.Width = 32
		.FormatColumn = "1 apos ``"
		.Position = 0
	endwith
	with .Items
		.AddItem("Item A")
		.AddItem("Item B")
		.AddItem("Item C")
	endwith
	.FilterBarPromptVisible = 1
	.FilterBarPromptPattern = "Item"
	.EndUpdate
endwith
|
|
908
|
How can I programmatically clear the control's filter
*** AddItem event - Occurs after a new Item has been inserted to Items collection. ***
LPARAMETERS Item
	with thisform.Gantt1
		.Items.AddBar(Item,"Task",{^2017-12-4},{^2017-12-14})
	endwith

*** Click event - Occurs when the user presses and then releases the left mouse button over the tree control. ***
LPARAMETERS nop
	with thisform.Gantt1
		.ClearFilter
	endwith

with thisform.Gantt1
	.BeginUpdate
	with .Chart
		.LevelCount = 2
		.FirstVisibleDate = {^2017-12-2}
		.PaneWidth(0) = 256
	endwith
	.Columns.Add("Item").DisplayFilterButton = .T.
	with .Columns.Add("Pos")
		.AllowSizing = .F.
		.AllowSort = .F.
		.Width = 32
		.FormatColumn = "1 apos ``"
		.Position = 0
	endwith
	with .Items
		.AddItem("Item A")
		.AddItem("Item B")
		.AddItem("Item C")
	endwith
	.FilterBarPromptVisible = 1
	.FilterBarPromptPattern = "B"
	.EndUpdate
endwith
|
|
907
|
Is it possible to prevent closing the control's filter bar, so it is always shown (prompt-combined)
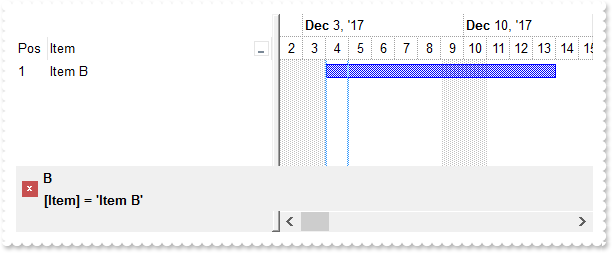
*** AddItem event - Occurs after a new Item has been inserted to Items collection. ***
LPARAMETERS Item
	with thisform.Gantt1
		.Items.AddBar(Item,"Task",{^2017-12-4},{^2017-12-14})
	endwith

with thisform.Gantt1
	.BeginUpdate
	with .Chart
		.LevelCount = 2
		.FirstVisibleDate = {^2017-12-2}
		.PaneWidth(0) = 256
	endwith
	.Columns.Add("Item").DisplayFilterButton = .T.
	with .Columns.Add("Pos")
		.AllowSizing = .F.
		.AllowSort = .F.
		.Width = 32
		.FormatColumn = "1 apos ``"
		.Position = 0
	endwith
	with .Items
		.AddItem("Item A")
		.AddItem("Item B")
		.AddItem("Item C")
	endwith
	.FilterBarPromptPattern = "B"
	.FilterBarPromptVisible = 3 && FilterBarVisibleEnum.exFilterBarVisible Or FilterBarVisibleEnum.exFilterBarPromptVisible
	with .Columns.Item(0)
		.FilterType = 240
		.Filter = "Item B"
	endwith
	.ApplyFilter
	.EndUpdate
endwith
|
|
906
|
Is it possible to prevent closing the control's filter bar, so it is always shown (prompt)
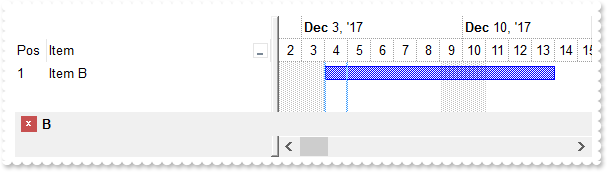
*** AddItem event - Occurs after a new Item has been inserted to Items collection. ***
LPARAMETERS Item
	with thisform.Gantt1
		.Items.AddBar(Item,"Task",{^2017-12-4},{^2017-12-14})
	endwith

with thisform.Gantt1
	.BeginUpdate
	with .Chart
		.LevelCount = 2
		.FirstVisibleDate = {^2017-12-2}
		.PaneWidth(0) = 256
	endwith
	.Columns.Add("Item").DisplayFilterButton = .T.
	with .Columns.Add("Pos")
		.AllowSizing = .F.
		.AllowSort = .F.
		.Width = 32
		.FormatColumn = "1 apos ``"
		.Position = 0
	endwith
	with .Items
		.AddItem("Item A")
		.AddItem("Item B")
		.AddItem("Item C")
	endwith
	.FilterBarPromptVisible = 1
	.FilterBarPromptPattern = "B"
	.EndUpdate
endwith
|
|
905
|
Is it possible to prevent closing the control's filter bar, so it is always shown
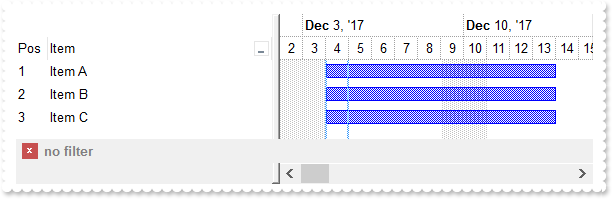
*** AddItem event - Occurs after a new Item has been inserted to Items collection. ***
LPARAMETERS Item
	with thisform.Gantt1
		.Items.AddBar(Item,"Task",{^2017-12-4},{^2017-12-14})
	endwith

with thisform.Gantt1
	.BeginUpdate
	with .Chart
		.LevelCount = 2
		.FirstVisibleDate = {^2017-12-2}
		.PaneWidth(0) = 256
	endwith
	.Columns.Add("Item").DisplayFilterButton = .T.
	with .Columns.Add("Pos")
		.AllowSizing = .F.
		.AllowSort = .F.
		.Width = 32
		.FormatColumn = "1 apos ``"
		.Position = 0
	endwith
	with .Items
		.AddItem("Item A")
		.AddItem("Item B")
		.AddItem("Item C")
	endwith
	.FilterBarCaption = "len(value) = 0 ? `<fgcolor=808080>no filter` : value"
	.FilterBarPromptVisible = 2
	with .Columns.Item(0)
		.FilterType = 240
		.Filter = "Item B"
	endwith
	.ApplyFilter
	.EndUpdate
endwith
|
|
904
|
How do I change the drop down filter icon/button (black)
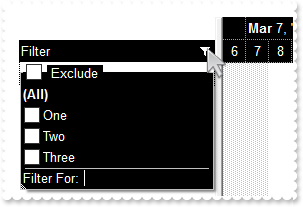
with thisform.Gantt1
	.BeginUpdate
	with .VisualAppearance
		var_s = "gBFLBCJwBAEHhEJAAEhABXUIQAAYAQGKIcBiAKBQAGYBIJDEMgzDDAUBjKKocQTC4AIQjCK4JDKHYJRpHEZyCA8EhqGASRAFUQBYiWE4oSpLABQaK0ZwIGyRIrkGQgQg"
		var_s = var_s + "mPYDSDNU4zVIEEglBI0TDNczhNDENgtGYaJqHIYpZBcM40TKkEZoSIITZcRrOEBiRL1S0RBhGcRUHZlWzdN64LhuK47UrWdD/XhdVzXRbjfz1Oq+bxve48Br7A5yYThd"
		var_s = var_s + "r4LhOFQ3RjIL4xbIcUwGe6VZhjOLZXjmO49T69HTtOCYBEBA"
		.Add(1,var_s)
	endwith
	.Object.Background(32) = -1
	.Object.Background(0) = 0x1000000
	.Object.Background(26) = RGB(0,0,1)
	.Object.Background(27) = RGB(255,255,255)
	.Object.Description(25) = "<bgcolor 0><fgcolor ffffff> Exclude </fgcolor></bgcolor>"
	.HeaderAppearance = 0
	.BackColorHeader = RGB(0,0,0)
	.ForeColorHeader = RGB(255,255,255)
	.HeaderVisible = 1
	.BackColorLevelHeader = .BackColor
	with .Columns.Add("Filter")
		.FilterList = 8448 && FilterListEnum.exShowExclude Or FilterListEnum.exShowCheckBox
		.DisplayFilterButton = .T.
		.AllowSort = .F.
		.AllowDragging = .F.
	endwith
	with .Chart
		.PaneWidth(0) = 196
		.LevelCount = 2
		.BackColorLevelHeader = thisform.Gantt1.BackColorHeader
		.ForeColorLevelHeader = thisform.Gantt1.ForeColorHeader
	endwith
	with .Items
		.AddItem("One")
		.AddItem("Two")
		.AddItem("Three")
	endwith
	.EndUpdate
endwith
|
|
903
|
How do I change the drop down filter icon/button (white)
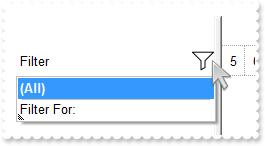
with thisform.Gantt1
	.BeginUpdate
	with .VisualAppearance
		var_s = "gBFLBCJwBAEHhEJAAEhABX8GACAADACAxSDEMQBQKAAzQFAYbhgHCGAAGQaBUgmFgAQhFcZQSKUOQTDKNYykCIRSDUJYkSZEIyjBI8ExXFqNACkGKwYgmNYiTLAcgANJ"
		var_s = var_s + "0WBaGIZJ4gOT5fDKMoEDRRYADFCscwxJybQAqGQKKb+VgAVY/cTyBIAEQSKA0TDOQ5TSKWB4JPZQRBEbZMNBtBIUJquKaqShdQJCU5FdY3Xblez9P7AMBwLFEC4NQ8YN"
		var_s = var_s + "YuPhjR4dRTIMhvVAsUArFh8Zg9GZZFjmDIDT4ydBLTQwcyVIKnP5qOa6XbmPoCQDYKxZHYxPzVDa3axuL76dqCAT7XrXNy1TbNRrzQKfcJqfCbdw2YaDZLOOT3fjuI4h"
		var_s = var_s + "hKaRzFAHJ+jYQ4xHuY4gHuGIXGeExqC8Tp6C+PoEm+G5ImycRgh0XwvDGa5rgOeoejyXwnFeQp2mkf5ClgBB9gCWIYAwfYAEKV58mkdwOggNArgOXY2EWLoDkKOA0mgb"
		var_s = var_s + "hOGgZApgaSBIHWSYHSmbApgYThmESZYJkIeIkgeCpfliLIHgpMIcmUYYYmODAlg2SI4mWfRfGOEguDcCRjFYAJihCQhJBSDoRmONgKEcI4kFCEJhhOVYTmYnAlEAQhWB"
		var_s = var_s + "MJYJGYWoWmWSR2F6F5lnkWAQhUAgpEieRWEuSYkjWGpmkmNhuhuZwJkYcocmaaYkjyEhngnUA6lEFAlAEgI="
		.Add(2,var_s)
		.Add(1,"CP:2 -4 -4 2 4")
	endwith
	.Object.Background(0) = 0x1000000
	.Object.Background(32) = .BackColor
	.HeaderAppearance = 0
	.BackColorHeader = RGB(255,255,255)
	.BackColorLevelHeader = .BackColor
	.HeaderHeight = 24
	.HeaderVisible = .T.
	with .Chart
		.PaneWidth(0) = 196
		.LevelCount = 2
		.BackColorLevelHeader = thisform.Gantt1.BackColorHeader
		.ForeColorLevelHeader = thisform.Gantt1.ForeColorHeader
	endwith
	with .Columns.Add("Filter")
		.DisplayFilterButton = .T.
		.AllowSort = .F.
		.AllowDragging = .F.
	endwith
	.EndUpdate
endwith
|
|
902
|
How can I display the week-number in ISO8601 format
with thisform.Gantt1
	.BeginUpdate
	with .Chart
		.PaneWidth(0) = 0
		.LevelCount = 2
		.FirstVisibleDate = {^2007-12-12}
		.DrawGridLines = -1
		.UnitScale = 256
		.WeekNumberAs = 0
		.FirstWeekDay = 1
	endwith
	.EndUpdate
endwith
|
|
901
|
How can I include the child items, when a filter is applied
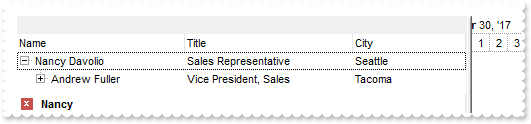
with thisform.Gantt1
	.BeginUpdate
	.ColumnAutoResize = .T.
	.ContinueColumnScroll = 0
	.MarkSearchColumn = .F.
	.SearchColumnIndex = 1
	.Indent = 16
	.LinesAtRoot = -1
	.FilterBarPromptVisible = .T. && .T.
	.FilterBarPromptPattern = "Nancy"
	.FilterInclude = 1
	.Chart.LevelCount = 2
	with .Columns
		.Add("Name").Width = 96
		.Add("Title").Width = 96
		.Add("City")
	endwith
	with .Items
		h0 = .AddItem("Nancy Davolio")
		.DefaultItem = h0
		.CellCaption(0,1) = "Sales Representative"
		.DefaultItem = h0
		.CellCaption(0,2) = "Seattle"
		h0 = .InsertItem(h0,Null,"Andrew Fuller")
		.DefaultItem = h0
		.CellCaption(0,1) = "Vice President, Sales"
		.DefaultItem = h0
		.CellCaption(0,2) = "Tacoma"
		h0 = .InsertItem(h0,Null,"Michael Suyama")
		.DefaultItem = h0
		.CellCaption(0,1) = "Sales Representative"
		.DefaultItem = h0
		.CellCaption(0,2) = "London"
		h0 = .AddItem("Janet Leverling")
		.DefaultItem = h0
		.CellCaption(0,1) = "Sales Representative"
		.DefaultItem = h0
		.CellCaption(0,2) = "Kirkland"
		h0 = .InsertItem(h0,Null,"Margaret Peacock")
		.DefaultItem = h0
		.CellCaption(0,1) = "Sales Representative"
		.DefaultItem = h0
		.CellCaption(0,2) = "Redmond"
	endwith
	.ApplyFilter
	.EndUpdate
endwith
|