

-
For instance, you can use the FormatLabel property to customize the labels and the subdivisions in your chart as you can see in the following screen shot ( "'Group <b>'+int(1 +dvalue/16)" ):

If the Unit property is exDay for several levels ( more than 1 level ), you can display your subdivisions using the Count property, based on 0, not based on the FirstVisibleDate property. You can get this layout using the
- Other sample would be, if you need to display the last Friday of each month using a different color, so in this case you can use the FormatLevel property as "(weekday(dvalue)=5 ? month(dvalue+7)!=month(dvalue) ? '<b><bgcolor=000000><fgcolor=FFFFFF>' ) + value" as in the following screen shot:
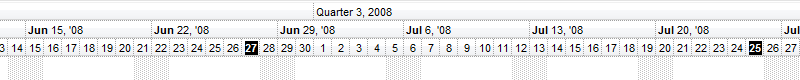
The screen shows in different colors the Jun 27 as being the last Friday of June, and the Jul 25 as being the last Friday on July.
- The following screen shot shows the week end days using a different foreground color ( FormatLabel property is "weekday(dvalue)=6 ? '<fgcolor=D0D0D0>Sa' : ( weekday(dvalue)=0 ? '<fgcolor=D0D0D0>Su' : value )" )
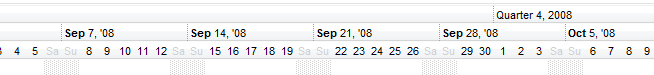
The value keyword in the FormatLabel property specifies the label of the level as it is before formatting ( in string format ). The dvalue keyword, indicates the date-time expression of the element in the label being formatted.
This property supports auto-numbering (index, pos, ...) expressions as described here. This property/method supports predefined constants and operators/functions as described here.
The following VB sample shows how you can highlight the last Friday for each month::
With G2antt1
	With .Chart
		.PaneWidth(0) = 0
		.FirstVisibleDate = #1/17/2008#
		.LevelCount = 2
		.Level(1).FormatLabel = "(weekday(dvalue)=5 ? month(dvalue+7)!=month(dvalue) ? '<b><bgcolor=000000><fgcolor=FFFFFF>' ) +" & _
" value"
	End With
End With
The following VB sample shows how you can define your own labels and subdivisions:
With G2antt1
	.BeginUpdate
	With .Chart
		.ToolTip = ""
		.PaneWidth(0) = 0
		.ScrollRange(exStartDate) = 0
		.ScrollRange(exEndDate) = 110
		.FirstVisibleDate = 0
		.ShowNonworkingDates = False
		.MarkTodayColor = .BackColor
		.LevelCount = 3
		With .Level(0)
			.ToolTip = ""
			.Alignment = CenterAlignment
			.Unit = exDay
			.Count = 16
			.FormatLabel = "'Group <b>'+int(1 +dvalue/16)"
		End With
		With .Level(1)
			.ToolTip = ""
			.Alignment = CenterAlignment
			.Unit = exDay
			.Count = 4
			.FormatLabel = " (abs(dvalue)/4) mod 4"
			.ReplaceLabel("0") = "Sub-Group <b>1</b>"
			.ReplaceLabel("1") = "Sub-Group <b>2</b>"
			.ReplaceLabel("2") = "Sub-Group <b>3</b>"
			.ReplaceLabel("3") = "Sub-Group <b>4</b>"
		End With
		With .Level(2)
			.ToolTip = ""
			.Unit = exDay
			.Count = 1
			.FormatLabel = "(abs(dvalue) mod 4)"
			.ReplaceLabel("0") = "A"
			.ReplaceLabel("1") = "B"
			.ReplaceLabel("2") = "C"
			.ReplaceLabel("3") = "D"
		End With
	End With
	.EndUpdate
End With
The following VB.NET sample shows how you can highlight the last Friday for each month::
With AxG2antt1
	With .Chart
		.PaneWidth(0) = 0
		.FirstVisibleDate = #1/17/2008#
		.LevelCount = 2
		.Level(1).FormatLabel = "(weekday(dvalue)=5 ? month(dvalue+7)!=month(dvalue) ? '<b><bgcolor=000000><fgcolor=FFFFFF>' ) +" & _
" value"
	End With
End With
The following VB.NET sample shows how you can define your own labels and subdivisions:
With AxG2antt1
	.BeginUpdate
	With .Chart
		.ToolTip = ""
		.PaneWidth(0) = 0
		.ScrollRange(EXG2ANTTLib.ScrollRangeEnum.exStartDate) = 0
		.ScrollRange(EXG2ANTTLib.ScrollRangeEnum.exEndDate) = 110
		.FirstVisibleDate = 0
		.ShowNonworkingDates = False
		.MarkTodayColor = .BackColor
		.LevelCount = 3
		With .Level(0)
			.ToolTip = ""
			.Alignment = EXG2ANTTLib.AlignmentEnum.CenterAlignment
			.Unit = EXG2ANTTLib.UnitEnum.exDay
			.Count = 16
			.FormatLabel = "'Group <b>'+int(1 +dvalue/16)"
		End With
		With .Level(1)
			.ToolTip = ""
			.Alignment = EXG2ANTTLib.AlignmentEnum.CenterAlignment
			.Unit = EXG2ANTTLib.UnitEnum.exDay
			.Count = 4
			.FormatLabel = " (abs(dvalue)/4) mod 4"
			.ReplaceLabel("0") = "Sub-Group <b>1</b>"
			.ReplaceLabel("1") = "Sub-Group <b>2</b>"
			.ReplaceLabel("2") = "Sub-Group <b>3</b>"
			.ReplaceLabel("3") = "Sub-Group <b>4</b>"
		End With
		With .Level(2)
			.ToolTip = ""
			.Unit = EXG2ANTTLib.UnitEnum.exDay
			.Count = 1
			.FormatLabel = "(abs(dvalue) mod 4)"
			.ReplaceLabel("0") = "A"
			.ReplaceLabel("1") = "B"
			.ReplaceLabel("2") = "C"
			.ReplaceLabel("3") = "D"
		End With
	End With
	.EndUpdate
End With
The following C++ sample shows how you can highlight the last Friday for each month::
/*
	Copy and paste the following directives to your header file as
	it defines the namespace 'EXG2ANTTLib' for the library: 'ExG2antt 1.0 Control Library'

	#import <ExG2antt.dll>
	using namespace EXG2ANTTLib;
*/
EXG2ANTTLib::IG2anttPtr spG2antt1 = GetDlgItem(IDC_G2ANTT1)->GetControlUnknown();
EXG2ANTTLib::IChartPtr var_Chart = spG2antt1->GetChart();
	var_Chart->PutPaneWidth(0,0);
	var_Chart->PutFirstVisibleDate("1/17/2008");
	var_Chart->PutLevelCount(2);
	var_Chart->GetLevel(1)->PutFormatLabel(_bstr_t("(weekday(dvalue)=5 ? month(dvalue+7)!=month(dvalue) ? '<b><bgcolor=000000><fgcolor=FFFFFF>' ) +") +
" value");
The following C++ sample shows how you can define your own labels and subdivisions:
/*
	Copy and paste the following directives to your header file as
	it defines the namespace 'EXG2ANTTLib' for the library: 'ExG2antt 1.0 Control Library'

	#import <ExG2antt.dll>
	using namespace EXG2ANTTLib;
*/
EXG2ANTTLib::IG2anttPtr spG2antt1 = GetDlgItem(IDC_G2ANTT1)->GetControlUnknown();
spG2antt1->BeginUpdate();
EXG2ANTTLib::IChartPtr var_Chart = spG2antt1->GetChart();
	var_Chart->PutToolTip(L"");
	var_Chart->PutPaneWidth(0,0);
	var_Chart->PutScrollRange(EXG2ANTTLib::exStartDate,long(0));
	var_Chart->PutScrollRange(EXG2ANTTLib::exEndDate,long(110));
	var_Chart->PutFirstVisibleDate(long(0));
	var_Chart->PutShowNonworkingDates(VARIANT_FALSE);
	var_Chart->PutMarkTodayColor(var_Chart->GetBackColor());
	var_Chart->PutLevelCount(3);
	EXG2ANTTLib::ILevelPtr var_Level = var_Chart->GetLevel(0);
		var_Level->PutToolTip("");
		var_Level->PutAlignment(EXG2ANTTLib::CenterAlignment);
		var_Level->PutUnit(EXG2ANTTLib::exDay);
		var_Level->PutCount(16);
		var_Level->PutFormatLabel(L"'Group <b>'+int(1 +dvalue/16)");
	EXG2ANTTLib::ILevelPtr var_Level1 = var_Chart->GetLevel(1);
		var_Level1->PutToolTip("");
		var_Level1->PutAlignment(EXG2ANTTLib::CenterAlignment);
		var_Level1->PutUnit(EXG2ANTTLib::exDay);
		var_Level1->PutCount(4);
		var_Level1->PutFormatLabel(L" (abs(dvalue)/4) mod 4");
		var_Level1->PutReplaceLabel(L"0",L"Sub-Group <b>1</b>");
		var_Level1->PutReplaceLabel(L"1",L"Sub-Group <b>2</b>");
		var_Level1->PutReplaceLabel(L"2",L"Sub-Group <b>3</b>");
		var_Level1->PutReplaceLabel(L"3",L"Sub-Group <b>4</b>");
	EXG2ANTTLib::ILevelPtr var_Level2 = var_Chart->GetLevel(2);
		var_Level2->PutToolTip("");
		var_Level2->PutUnit(EXG2ANTTLib::exDay);
		var_Level2->PutCount(1);
		var_Level2->PutFormatLabel(L"(abs(dvalue) mod 4)");
		var_Level2->PutReplaceLabel(L"0",L"A");
		var_Level2->PutReplaceLabel(L"1",L"B");
		var_Level2->PutReplaceLabel(L"2",L"C");
		var_Level2->PutReplaceLabel(L"3",L"D");
spG2antt1->EndUpdate();
The following C# sample shows how you can highlight the last Friday for each month::
EXG2ANTTLib.Chart var_Chart = axG2antt1.Chart;
	var_Chart.set_PaneWidth(0 != 0,0);
	var_Chart.FirstVisibleDate = "1/17/2008";
	var_Chart.LevelCount = 2;
	var_Chart.get_Level(1).FormatLabel = "(weekday(dvalue)=5 ? month(dvalue+7)!=month(dvalue) ? '<b><bgcolor=000000><fgcolor=FFFFFF>' ) +" +
" value";
The following C# sample shows how you can define your own labels and subdivisions:
axG2antt1.BeginUpdate();
EXG2ANTTLib.Chart var_Chart = axG2antt1.Chart;
	var_Chart.ToolTip = "";
	var_Chart.set_PaneWidth(0 != 0,0);
	var_Chart.set_ScrollRange(EXG2ANTTLib.ScrollRangeEnum.exStartDate,0);
	var_Chart.set_ScrollRange(EXG2ANTTLib.ScrollRangeEnum.exEndDate,110);
	var_Chart.FirstVisibleDate = 0;
	var_Chart.ShowNonworkingDates = false;
	var_Chart.MarkTodayColor = var_Chart.BackColor;
	var_Chart.LevelCount = 3;
	EXG2ANTTLib.Level var_Level = var_Chart.get_Level(0);
		var_Level.ToolTip = "";
		var_Level.Alignment = EXG2ANTTLib.AlignmentEnum.CenterAlignment;
		var_Level.Unit = EXG2ANTTLib.UnitEnum.exDay;
		var_Level.Count = 16;
		var_Level.FormatLabel = "'Group <b>'+int(1 +dvalue/16)";
	EXG2ANTTLib.Level var_Level1 = var_Chart.get_Level(1);
		var_Level1.ToolTip = "";
		var_Level1.Alignment = EXG2ANTTLib.AlignmentEnum.CenterAlignment;
		var_Level1.Unit = EXG2ANTTLib.UnitEnum.exDay;
		var_Level1.Count = 4;
		var_Level1.FormatLabel = " (abs(dvalue)/4) mod 4";
		var_Level1.set_ReplaceLabel("0","Sub-Group <b>1</b>");
		var_Level1.set_ReplaceLabel("1","Sub-Group <b>2</b>");
		var_Level1.set_ReplaceLabel("2","Sub-Group <b>3</b>");
		var_Level1.set_ReplaceLabel("3","Sub-Group <b>4</b>");
	EXG2ANTTLib.Level var_Level2 = var_Chart.get_Level(2);
		var_Level2.ToolTip = "";
		var_Level2.Unit = EXG2ANTTLib.UnitEnum.exDay;
		var_Level2.Count = 1;
		var_Level2.FormatLabel = "(abs(dvalue) mod 4)";
		var_Level2.set_ReplaceLabel("0","A");
		var_Level2.set_ReplaceLabel("1","B");
		var_Level2.set_ReplaceLabel("2","C");
		var_Level2.set_ReplaceLabel("3","D");
axG2antt1.EndUpdate();
The following VFP sample shows how you can highlight the last Friday for each month::
with thisform.G2antt1
	with .Chart
		.PaneWidth(0) = 0
		.FirstVisibleDate = {^2008-1-17}
		.LevelCount = 2
		var_s = "(weekday(dvalue)=5 ? month(dvalue+7)!=month(dvalue) ? '<b><bgcolor=000000><fgcolor=FFFFFF>' ) + "
		var_s = var_s + "value"
		.Level(1).FormatLabel = var_s
	endwith
endwith
The following VFP sample shows how you can define your own labels and subdivisions:
with thisform.G2antt1
	.BeginUpdate
	with .Chart
		.ToolTip = ""
		.PaneWidth(0) = 0
		.ScrollRange(0) = 0
		.ScrollRange(1) = 110
		.FirstVisibleDate = 0
		.ShowNonworkingDates = .F.
		.MarkTodayColor = .BackColor
		.LevelCount = 3
		with .Level(0)
			.ToolTip = ""
			.Alignment = 1
			.Unit = 4096
			.Count = 16
			.FormatLabel = "'Group <b>'+int(1 +dvalue/16)"
		endwith
		with .Level(1)
			.ToolTip = ""
			.Alignment = 1
			.Unit = 4096
			.Count = 4
			.FormatLabel = " (abs(dvalue)/4) mod 4"
			.ReplaceLabel("0") = "Sub-Group <b>1</b>"
			.ReplaceLabel("1") = "Sub-Group <b>2</b>"
			.ReplaceLabel("2") = "Sub-Group <b>3</b>"
			.ReplaceLabel("3") = "Sub-Group <b>4</b>"
		endwith
		with .Level(2)
			.ToolTip = ""
			.Unit = 4096
			.Count = 1
			.FormatLabel = "(abs(dvalue) mod 4)"
			.ReplaceLabel("0") = "A"
			.ReplaceLabel("1") = "B"
			.ReplaceLabel("2") = "C"
			.ReplaceLabel("3") = "D"
		endwith
	endwith
	.EndUpdate
endwith