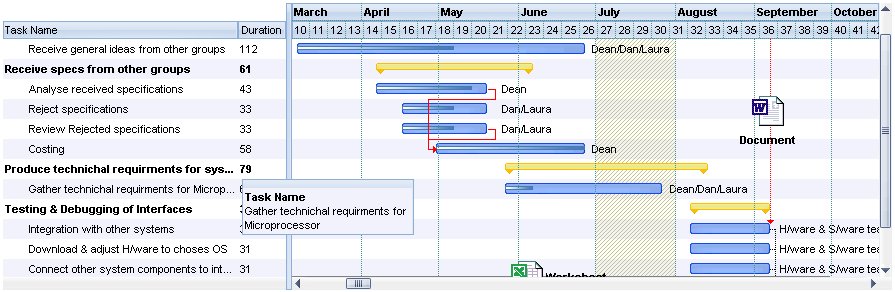
Exontrol's ExG2antt component provides a powerful solution for creating timeline views, also known as Gantt charts. A Gantt chart presents a time-phased graphical display of activities and their durations. Typically, activities are listed with related tabular data on the left, while time intervals and durations are visualized as horizontal bars across the timeline.
ExG2antt merges the functionality of two components, ExGrid and ExGantt, into a single, integrated control. It displays timeline charts within a multi-column, hierarchical tree structure, allowing complex data organization with rich visual representation.
The component also supports a skinnable interface, enabling developers to apply custom visual styles ("skins") to various parts of the control. Skins enhance the appearance and user experience, and they are easy to create and apply.
Features include:
1. Printing and Exporting
-
Print and Print Preview support
-
Export support – Ability to save the control's content to Enhanced Metafile (EMF), and from there to BMP, JPG, GIF, PNG, and PDF formats
-
Ability to save/load the control's data to/from XML files
2. Data Access
-
ADO and DAO support
-
DataSets for /NET
3. UI and Appearance
-
Skinnable Interface support (apply skins to parts of the control)
-
Custom Row Designer (custom layout for rows)
-
Scroll Line by Line support (smooth scrolling with variable-height items)
-
Multiple Columns
-
Locked/Fixed columns support
-
Split, Merge cells support
-
Single/Multiple Lines/Levels/Expandable Header support
-
Overview Layout/Map support
-
Histogram support
-
Regional and Language Options support (date and time formatting)
-
Right-to-left support (Hebrew, Arabic, etc.)
-
Alternative HTML labels support for best fit in the level's time unit
-
Multi-Line Built-In HTML Tooltip support
-
Ability to insert hyperlinks anywhere in the cells, bars, or links
-
Editors support
-
Undo/Redo support
4. Filtering and Sorting
-
Filter support
-
Filter-Prompt support (filter while typing with visible filter bar)
-
Filter-On-Type support (column filtering as you type)
-
Sorting by Single or Multiple Column support
5. Zoom and Scale
-
Zoom and Scale support (including at run-time)
-
Ability to zoom in/out the entire chart (drag header or middle-click resize)
-
Ability to magnify only a portion of the chart while keeping the rest unchanged
6. Time Representation
-
Ability to specify multiple levels using custom built-in HTML format
-
Show the current date-time position (various styles including EBN files)
-
Highlight/mark date-time zones using colors, EBNs, patterns, HTML captions
7. Nonworking Time Support
-
Nonworking support
-
Nonworking Days, Nonworking Hours support
-
Specify non-working parts for any item
- Specify bars that are treated as non-working parts of the items
8. Bars and Links
- Draw lines or links between bars
- Semi-Transparent and Opaque Bars support
- Summarize bars (auto-update on child bar changes)
- Group bars, preserve length or spacing
- Select bars and links at runtime
- Move and resize bars on the fly
- Customize overlaid bars (offsets, transparency, colors, shapes, etc.)
- Link bars using the mouse
- Display pictures or HTML text on any link
- Assign multiple bars to a single item
- Predefined bar types (e.g., task, milestone)
- Define custom bars (shapes and patterns)
- Define the starting and ending corners from icons
9. Annotations and Notes
- Associate a bar/date with customizable, movable boxes or notes, including HTML text, images, links, etc.
10. Advanced Scheduling
- Conditional Format support
- Computed Fields support
- Precedence Diagramming Method (PDM – project plan scheduling)
® ExG2antt is a trademark of Exontrol. All Rights Reserved.
 ExG2antt
