The histogram shows the overloads and subloads of your current planning situation. The histogram- graph shows the count of specified tasks day by day, or unit by unit. Use the HistogramItems property to specify the number of items being displayed in the histogram. Use the HistogramGridLinesColor property to specify the color to show the grid lines in the histogram.
The histogram shows in percents, the over-allocations of your current planning situation using the effort of the task divided by the length of the task (effort/length). The exHistOverAllocation flag can be combined with exHistOverAllocationFixed or exHistOverAllocationMultiply. The work-load for a task is computed as exBarEffort / length of the bar. The work-load for the task is the work effort / task duration. (i.e. If item.exBarEffort = 1 and bar's length is 10 days, then the work-load = 0.1 or 10%). The histogram- graph shows the sum of the work-loads (the work-load of each task item is added, unit by unit).
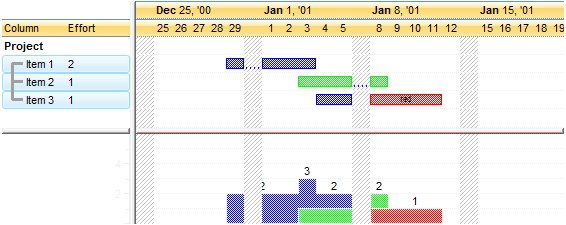
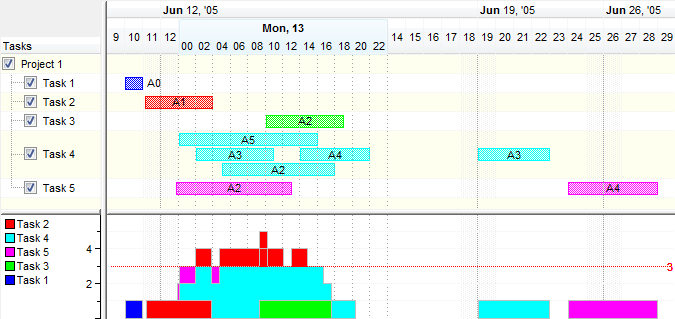
The bars in the histogram shows cumulative colors. The exHistCumulative can be applied to exHistOverload and exHistOverAllocation values. For instance, the exHistOverAllocation + exHistCumulative defines a cumulative histogram for exHistOverAllocation type. The HistogramCumulativeColors property defines the number of colors being displayed in the cumulative histogram. The HistogramCumulativeColor property specifies a cumulative color based on its index. Use the HistogramCumulativeShowLegend property to specify whether the index of the column being shown in the left side of the histogram to show the legend of the colors being used for cumulative bars. The HistogramPattern property should not be a curve, in order to show a cumulative histogram, in other words should be a predefined pattern. You can change the original color of the bars that generates the cumulative histogram using the HistogramCumulativeOriginalColorBars property.
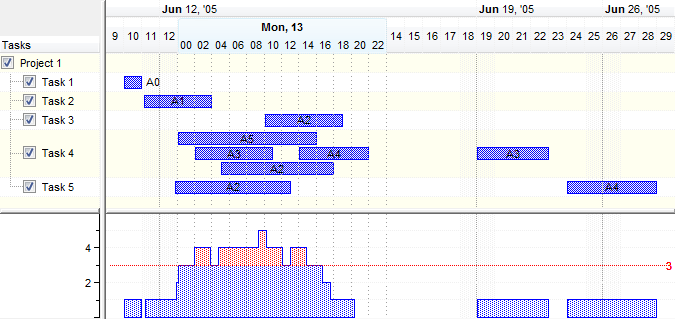
The following screen shot shows the bars using the original color in the items that generates the histogram (when HistogramCumulativeOriginalColorBars property is -1 ( True ), by default ). All bars in the same item does not change their color, instead the reflection of the bar in the histogram gets a cumulative color.
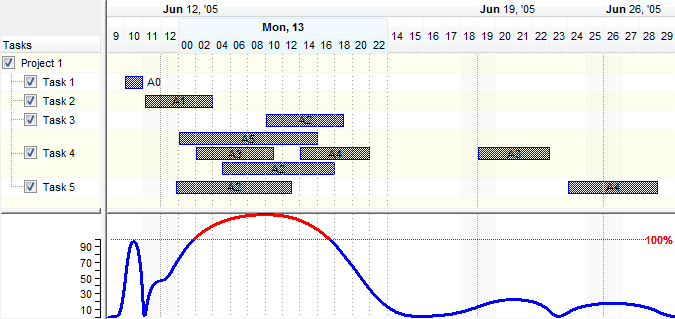
The following screen shot shows the bars that generates the cumulative histogram using cumulative colors when HistogramCumulativeOriginalColorBars property is 0 ( False ). All bars in the same item gets a cumulative color.
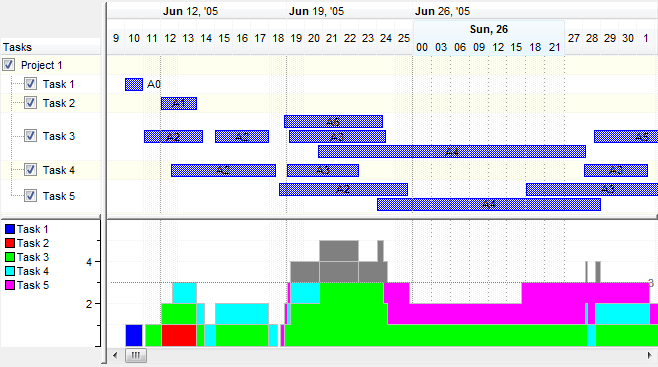
The following screen shot shows the bars that generates the cumulative histogram using cumulative colors when HistogramCumulativeOriginalColorBars property is 1 ( exKeepOriginalColor ). The bars keeps their original color in the histogram.